
Mapping A New Future For Water Main Break Prediction


Every water distribution utility has a strategy for infrastructure asset management and repair — from simply reacting to breaks, to scheduling main replacements based on system-specific history, to prioritizing infrastructure repairs based on mathematical calculations of risks and consequences.
In a field where even the best historical records can be less-than-comprehensive, multiple companies already offer solutions to predict likelihood of failure (LOF) based on available utility history, external databases, and artificial intelligence (AI) using machine learning (ML). These solutions are calculating likelihood of water main failures by mapping correlations among real-world data points far beyond the depth of existing utility data. The potential is intriguing to say the least.
The Problems With Hidden Infrastructure
For as much as any utility knows about its own infrastructure, there are additional unknown factors that complicate accurate predictive maintenance forecasting. Utility managers are essentially stuck between two extremes. They can focus their time and budget on reacting to known water main failures, or they can attempt to predict areas of piping infrastructure at greatest risk. The first approach guarantees service disruptions and a certain level of emergency costs. The second approach is limited to the utility’s scope of knowledge, and can require some tradeoffs between costs and confidence in results.
Typical desktop modeling methods limited by available data can result in unnecessary expenditures. Replacing substantial stretches of water main that still have years of useful service life left in them can chew up as much as 30 to 50 percent of an annual maintenance budget. Using AI solutions enhanced with external data can generate the confidence to leave still-viable stretches or water main intact, and free the related funding to be utilized on more pressing needs.
Understanding Predictive Analytics Powered By AI
In an industry where so many assets are buried out of sight, and where hard-earned infrastructure experience is valued, having faith in data scientists who never got their hands wet or dirty at the bottom of a trench can be difficult to accept at first. As with any other new technology, however, following step-by-step logic and proving out concepts based on performance against known results can ease concerns and build confidence in the predictive powers of AI/ML.
The beauty of ML-empowered AI is that it can start with any level of utility recordkeeping, fill in data gaps, supplement that information with data from outside sources, analyze a seemingly infinite number of relationships among all those factors, yet yield quite accurate insight on related trends. In some cases, condition assessments using these methods have been completed in as little as two to four weeks.
There are three major phases to the process:
- Data Acquisition And Formatting. The majority of effort in taking advantage of AI/ML for predictive analysis (60 percent to 80 percent) is required for cleaning and formatting data into computer-usable formats. With data from a wide variety of sources normalized and properly formatted, a computer can compare, contrast, and provide statistical weighting to a vast number of patterns hidden within that data.
Internal utility asset data typically includes water main pipe segment ID numbers from connector to connector, length, diameter, material, year of installation, break history, and whether it is a lined pipe or unlined.
- Machine Learning. The powerful potential in AI/ML is that it can discern and quantify valuable inferences and relationships across data gathered from well beyond water utility records. These can include overlays of U.S. Geological Survey data, elevation changes, soil conditions (e.g., density and pH), seismic data, proximity to transit systems, and proximity to salt water.
All of that data can be assigned to individual pipe segments by GPS coordinates. Unlike methodologies that assign all characteristics across a broad sample of pipeline, with AI/ML the multiple variables can be calculated, foot by foot, for the entire length of a water-main segment and the entire system. Best of all, the more data the system analyzes, the more it can refine its algorithms and the more insight it can provide.
- Evaluating Both LOF And Consequences. The best AI/ML solutions provide a continuum of ratings that enables utilities to rank the LOF in any given water-main segment (Figure 1). By comparing that LOF against the potential consequences of a failure in a particular segment, the utility can rate their risk exposure segment by segment, and assign budget and scheduling priorities accordingly. For example, a medium-level LOF under a main thoroughfare might be assigned a higher priority than a comparable LOF on a residential cul-de-sac.
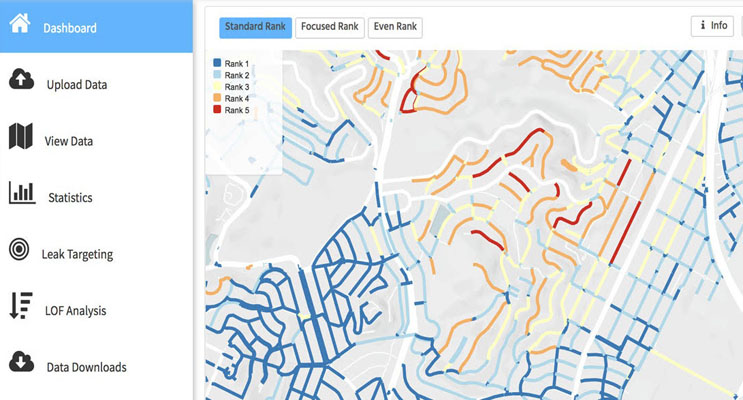
Figure 1. Mapping out color-coded LOF data across a geographic area can help a utility adjust priorities by overall risk or by specific consequences in high-profile areas of the system. (Source: Fracta, Inc.)
One interesting approach that has opened the eyes of water utility managers to the power of AI has been a proof-of-concept technique where historical break data ranging from 5 years old to 30 years old has been used to predict LOF for the most recent five years. When the AI-generated “forecast” is overlaid on the previously undisclosed most recent five-year history of actual water main breaks, the corresponding match-ups — segment by segment — can prove uncanny. This approach has led to instances of 80 percent to 90 percent correlation between the forecast model and the actual occurrences.
New Hope For Smaller Systems
Despite the skewed distribution of water utilities by size — relatively few large urban water utilities vs. numerous small utilities scattered across a geographically diverse landscape — the benefits of AI/ML for optimizing infrastructure capital expenditures are not beyond the realm of possibility for smaller water utilities.
To the contrary, an ancillary benefit of AI/ML for infrastructure asset management in the water space is that learnings from early evaluations provide a cumulative advantage in terms of subsequent database development and algorithm enhancement. Thanks to this network effect, even where smaller under-budgeted utilities have minimal historic data from their own infrastructure, they should be able to benefit from experience generated by earlier assessments at other utilities.