
Coping With Mixed-Source Water Quality And Corrosion Challenges


When it becomes necessary to expand or blend water supply sources, variety is not necessarily the spice of life. Whether new water sources are surface water or groundwater, fresh, brackish, seawater, or water recovered from aquifer storage, they can ultimately impact water treatment plant (WTP) operations and finished water quality — including compliance with the U.S. EPA Lead and Copper Rule.
Why The Concern?
The Flint, MI water crisis back in 2014 opened eyes to the significant impact a new water supply source could have on subsequent aspects of treatment and distribution. In that case, failure to anticipate the corrosive effects of a new water source on existing piping systems resulted in lead leaching into the consumer water supply.
There are many potential reasons for accessing new water sources — including drought or water scarcity, regional growth, seasonal population peaks in resort areas, water reuse, or periodic events such as harmful algae blooms or accidental contamination spills. Each new water source comes with its own makeup and its own challenges — organic content, pH, hardness, temperature, etc. Those factors, in combination with the proportion of blending between two or more sources, can have varying impacts relative to the amount of water from each source. In fact, any change in a water treatment process — from source water chemistry, to chemical treatments for coagulation or disinfection, to distribution piping infrastructure — has the potential to mobilize lead or copper in the distribution system and create negative impacts farther downstream.
According to Peter D’Adamo, Water Treatment Director at HDR, Inc., in Raleigh, NC, “It is important to understand source water quality, what happens when different sources are mixed, and how that process can impact the distribution system. Those impacts involve not only lead and copper, but other things such as disinfection byproducts (DBPs) formed when disinfectants are added during water treatment.” DBPs can be a concern particularly when a WTP switches from groundwater (which is typically low in terms of organic carbon materials) to surface water (which can vary widely in terms of organic carbon content). Other concerns can include taste and odor compounds or contaminants of emerging concern (CECs) — including microbials or chemical pollutants.
Basic Steps To Take
Water treatment professionals should be monitoring periodic water evaluations in some form throughout the year — via desktop analysis, demonstration testing, and/or hydraulic modeling. The ideal approach is to combine and compare multiple techniques.
- Desktop analysis can characterize the qualities of each different source water supply, particularly for corrosion-influencing factors. This step is important in terms of identifying the potential impacts of various water sources relative to regulatory compliance and customer satisfaction.
- Temperature and pH
- Alkalinity and dissolved inorganic carbon (DIC)
- Oxidants — both dissolved oxygen and disinfectants
- Total dissolved solids (TDS) and natural organic material (NOM)
- Calcium hardness, chloride, sulfate, hydrogen sulfide, and ammonia
- Demonstration testing can assess the relevant characteristics of source waters and blends in the treatment process and distribution system. These can include system age, diverse pipeline materials (e.g., lined or unlined cast iron, galvanized, copper, even lead service lines), and key facilities (e.g., pumping stations, tanks, other distribution system elements, etc.) that can impact chemical stability.
With knowledge of the WTP, distribution system, and the range of water quality running through it, it is possible to establish parameters and goals related to how and where to treat new sources and in which proportions to blend them.
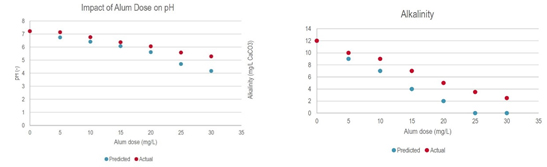
With respect to calcium carbonate stability in the water system, a variety of corrosion indices can be used (e.g., Langelier Saturation Index [LSI], Ryznar Stability Index [RSI], Calcium Carbonate Precipitation Potential [CCPP], and others). The Larson Ratio (LR) and the Chloride to Sulfate Mass Ratio (CSMR) can be used to quantify how anions such as chloride and sulfate impact galvanic corrosion and lead release. The best index choice is typically site-specific, based on water characteristics and chemical additives, and will require verification testing to confirm suitability for the application. - Hydraulic modeling can be used to assess water chemistry, corrosion indices, the effects of chemical additives (Figures 1a and 1b), and their impacts on blended water characteristics from different sources and at different proportions. The Rothberg-Tamburini-Winsor (RTW) Model, for example, calculates many of the characteristics needed to determine the best blend of water from two sources. Many WTPs use hydraulic modeling to identify water quality information based on how source waters move throughout the system, pressure management, and planning for future growth.
Graphics courtesy of HDR
Figures 1a and 1b. These charts show the proportional accuracy of the RTW Model predicting chemical treatment effects on pH and alkalinity values at different dosing levels.
Going A Step Further
Because not all critical parameters of water chemistry can be evaluated through theoretical desktop methodologies, demonstration testing is recommended under the 2016 EPA Guidance Manual for Lead and Copper Rules. The following test procedures can help in establishing guidelines on optimum dosing for water treatment chemicals.
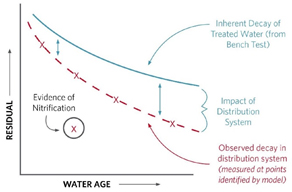
Bench-scale coupon testing based on parameters identified from desktop testing can be helpful for evaluating corrosion-control alternatives, monitoring performance relative to baseline conditions, and comparing against actual field readings to help calibrate water analysis models. Comparing evidence of actual nitrification of water aging in the distribution system vs. aging under benchtop testing conditions (Figure 2) can further help in calibrating water quality models. Benchtop test results can also help in refining parameters for subsequent testing.
Graphic courtesy of HDR
Figure 2. Confirming field test results against benchtop test results can help WTP operators identify the comparative impacts of the distribution system on water quality. This water quality model chart shows differences in nitrification over time.
The Bottom Line
Whichever approach a WTP takes toward monitoring and testing various source water inputs, the ultimate goal should be to optimize corrosion control treatments to promote and maintain lead scale stability within the distribution system. Some forms of lead or lead scale (e.g., hydrocerussite, typically dominant in surface water) are more stable than others (e.g., cerussite, typically dominant in groundwater) (Figure 3). That is why it is important to understand how water quality models might be used to predict lead solubility based on pH and the proportions of surface water vs. groundwater.
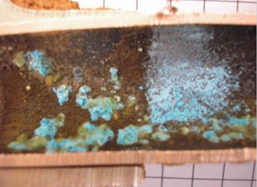
Photo courtesy of HDR
Figure 3. Variations in cerussite and hydrocerussite levels for groundwater vs. surface water can lead to differences of lead solubility in a distribution system based on surface-water-to-groundwater ratios.
The range of approaches to accommodating new source water blending or chemical treatments can include a combination of capital improvements and operational changes. Physical improvements might involve modifications to the water treatment process lines or structural changes in distribution systems and storage tanks. Operational changes can involve the improvement of monitoring, modeling, and control efforts, the adjustment of source-water blending proportions, or the modification of chemical treatment regimens or rates of application.
This drinking water operations chart preview includes information on managing corrosiveness based on finished water calcite stability. This Safe Drinking Water Act (SDWA) chart preview addresses considerations related to lead, copper, and DBPs.