
A Water-Treatment Report Card: How Are We Doing?


Faced by ever-changing challenges of water scarcity, source-water quality, regulated discharges, aging infrastructure, economics, and social equality, water- and wastewater-treatment professionals are constantly forced to re-evaluate their efforts and optimize their approaches. Comparing their own performance to that of associates in similar situations is an important way to keep pace. Here is a new report to help them do just that.
The 2021 City Water Optimisation Index report (Figure 1) — developed by Economist Impact and sponsored by DuPont Water Solutions — delves into the water- and wastewater-treatment approaches of 51 cities around the world, including four in the U.S. Each city received separate scores to measure how they are addressing key issues of reliability, accessibility, and sustainability — plus a composite score across all activities.
Graphic provided by Economist Impact and its interactive Water Optimiser Tool
Figure 1. This 48-page document provides in-depth analysis of current practices among 51 major cities around the globe with regard to how those actions affect water quality and operating efficiency.
Assessing The Status Quo
As a snapshot in time, the report offers water utilities and their municipal decision-makers insight into current operations. The plan is for the report to expand upon the current list of cities in future years. But even cities that are not included in the current index can gain insights into potential improvements simply from reading how the index was created and applied to the cities involved.
The 48-page document introduces the concept of that index, outlines eight key findings, highlights positive steps being taken among cities across all income levels, provides brief profiles of successful programs, and spells out the process and the rationale of the methodology used to generate the index. Some of its high-level findings include:
- Accountability. Most cities in the study have adopted auditing and accounting systems, with many of them incorporating real-time monitoring.
- Economics. High scores across all categories of the ratings are not necessarily linked to economic standing. For example, some low- to middle-income cities performed better than their higher income counterparts when it came to reclaimed water use.
- Sustainability. While sustainability was the lowest ranking category across the study, there is hope. In many cases, the opportunity to improve sustainability lies in affordable policies.
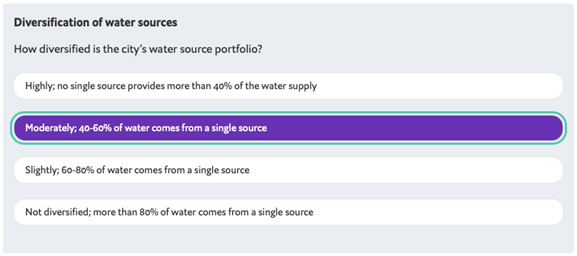
Findings from individual cities in the study are reported in both graphic (Figure 2) and case-study formats. Readers of the report can gain ideas for improvements in their own operations or find justifications to share with high-level influences in their organizations by reviewing the methodology for the report and its relationship to the scores for the highest-rated cities in each category.
Graphic provided by Economist Impact and its interactive Water Optimiser Tool
Figure 2. Step-by-step breakdowns of water-system ratings across 47 distinct performance criteria in the index show the many incremental steps municipal water utilities can take to improve their rankings.
An Interactive Tool For Improvement
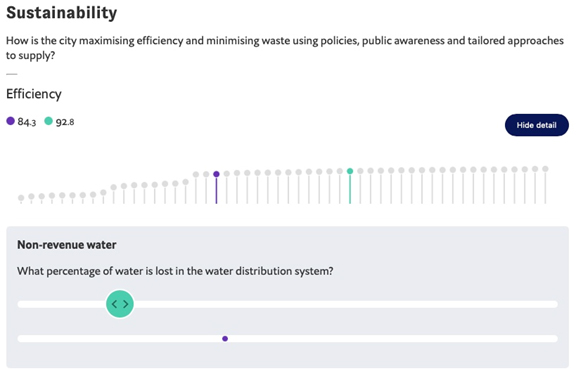
Beyond its value as a benchmark on the status of the industry, the indexing tool used to generate the report offers value to cities on the list as well as those who have not yet made the list. Perhaps the most informative aspect of the project is this interactive water optimisation calculator (Figure 3), which enables any utility decision-maker to examine key considerations in the rating methodology and to experiment with the relative potential value of various improvements to their own performance in specific areas.
Graphic provided by Economist Impact and its interactive Water Optimiser Tool
Figure 3. Interactive menu selections and slide bars in the online calculator give readers an opportunity to see how much specific actions can improve their performance results (shown in aqua) as compared to the status quo (shown in purple).
What’s Covered?
The index covers a wide range of topics that water and wastewater utilities deal with daily. While more affluent cities might rank higher in certain categories, delving into the index categories and scoring methodology can highlight practical areas of improvement for virtually any city. These select topics indicate just how far-reaching and thought-provoking those categories are:
- Reliability. Topics in this category include diversity of water quality, the diversity of water sources, and utility management and coordination. For example:
- Does the city have mandatory water standards, and how much of the city’s treated water meets or exceeds World Health Organization (WHO) standards?
- How frequently does the city monitor its water quality?
- How is the city’s water-management leadership organized and implemented to promote reliability?
- Accessibility. This category addresses topics ranging from water-service connectivity to sanitation to equitable water pricing to risk mitigation to management/coordination, including:
- What percentage of households are connected to city-managed potable-water and wastewater systems?
- How extensive are the city’s risk-mitigation strategies for water/wastewater systems?
- How comprehensive are the city’s data, monitoring, and analytics for managing water system operation and growth?
- Sustainability. In terms of waste reduction, efficiency, water conservation, tailoring for the right use, and management coordination, how sustainable are the city’s utility practices?
- How much of data management is automated?
- How high are non-revenue water losses?
- Does wastewater treatment include energy recovery and nutrient recovery?
- What steps are taken toward conservation education/standards and reclaimed water practices?
- Do management practices address waste-to-resource collaboration and environmental/ecosystem protections?
Where Do We Go From Here?
Every city and every utility with an interest in the health and welfare of its citizens has a wish-list of improvements to make in its water- and wastewater-treatment operations. The key is identifying those that can wring the most value from the funds available for investment. Using the 2021 City Water Optimisation Index and its 28 footnoted links to in-depth resources to explore those opportunities and evaluate the successes of various cities can spur new ideas and be the impetus for efforts to reap the benefits of a truly circular water economy.