
Understanding Big Data In The Water Industry
By Dr. Andy Shaw
If you feel like you have too much data but not enough understandable or usable information, fine-tuning data collection and funneling it into an integrated data management system may be the way to become more proactive and make better decisions.
At a very basic level, Big Data just means we have a lot of data. Water utilities see data from supervisory control and data acquisition (SCADA) systems, including flow statistics, online monitoring, dissolved oxygen (DO) measurements, and air flows, as well as data from laboratory information management systems (LIMS) and computerized maintenance management systems (CMMS), to name several examples.
Such data is beneficial, and much of it has been around for years. Unfortunately, the way data is gathered at treatment facilities is often fragmented. There are silos of data in computer systems that don’t always talk to each other. The Internet Age has ushered in the ability to funnel disparate data into a single, meaningful pool of information that allows water and wastewater treatment plant operators to understand, manage, and use it to optimize plant reliability and performance. Big Data initiatives and new data management tools enable us to turn all that data into understandable, useful information that helps us become more proactive and make better decisions about plant operations.
For example, Black & Veatch offers ASSET360™, a smart analytics platform to give utilities, cities, and other entities a holistic, 360-degree understanding of their infrastructure-based systems. Although the focus on Big Data in the water industry is relatively new, comprehensive data management isn’t new for energy utilities; Black & Veatch has provided asset analytic solutions to utility clients for more than 20 years and has operated a smart analytics monitoring and diagnostics service for more than 10 years. The company’s utility analytics include operational intelligence and adaptive planning solutions.
Sometimes You Have To Get MAD To Be Smart
No matter what specific services or tools water and wastewater utilities choose to use, it’s important to develop a management plan, pull all important data together, and take advantage of dashboards and smart screens that use that data to perform calculations and identify trends. Then, utility managers can break the information down to answer questions such as “Where am I using energy or spending my dollars?” or “What am I spending on energy and chemicals in different parts of the facility?”
Furthermore, utility staff with such information in hand can proactively identify potential problems before they happen rather than react to something such as a broken pump. Although SCADA systems have real-time capabilities, displaying current status and immediately warning of problems, being able to predict a potential problem through use of smart analytic platforms is a game changer. The next step — pooling data and using analytical tools to predict where we should be heading to become more proactive — is a big one for the water industry. We’re getting smarter all the time.
Becoming smarter, however, requires focus on the quality as well as the quantity of our data, shifting our focus from Big Data to bad data. If sensors are not cleaned, calibrated, or properly used, for example, it doesn’t matter what we do with the resulting data. The starting point is to make sure you have good primary measurements.
In Smart Water Utilities: Complexity Made Simple (IWA Publishing, 2016), Dr. Pernille Ingildsen and Dr. Gustaf Olsson consider what utilities need to do to be smart. They boil it down to a simple, yet very useful, framework and suggest that water utilities have to be “MAD” to be smart.
As they explain, M is for MEASURE, because we have to focus on having good measurements in the right place; A is for ANALYTICS, because we have to understand and analyze the data we collect; and D pertains to the DECISION-making process. Using what we know to make good decisions can be an automated process in some cases. It can be helpful to split Big Data into these three parts.
In terms of accuracy, the instrumentation that we have now is better than ever, whereas sensors were a weak point in the past. People generally understand the need to clean and calibrate instruments, but it can still be an important starting point.
Improved analytics are more the focus today, with the benefits and needs explained above.
Decisions will be the next focus, and fairly soon, as evidenced by research now underway.
Smart analytics — called Smart Integrated Infrastructure (SII) at my company — have been applied to power stations for many years. In SII, a driving question is “How efficient is the plant as a whole?” With the ability to zoom in on specific pieces and ask questions such as “How many dollars per hour does it cost us not to have this part of the plant operating as well as it could?” utilities and cities can use smart analytics to make smarter decisions by proactively identifying and prioritizing improvements.
Black & Veatch has developed tools specifically for combined heat and power (CHP), membranes, and activated sludge. We are working with the city of Lawrence, KS, to refine tools to enable the city’s plant managers to optimize operations. Initially these tools will be used at the wastewater treatment plant, but eventually they will also be extended to the city’s water treatment facility. Plant operators are already seeing the benefit of being able to visualize information by pulling all operations data together in a consolidated database.
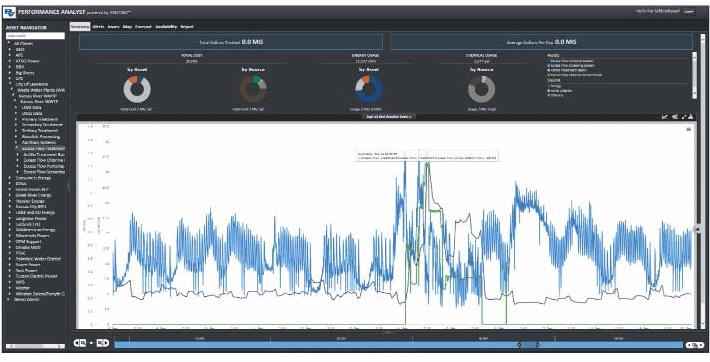
In Lawrence, KS, where the Black & Veatch ASSET360 system is used to track operating costs, data shows the impacts of wet-weather events on treatment costs. The total cost per 1,000 gallons is shown in purple, the secondary treatment flow rate is shown in blue, and the flow rate to the Actiflo system is shown in green. There is a jump in treatment costs during a storm event due to the extra costs associated with operating the Actiflo process.
Big Data Basics
Despite the current focus for many on improving analytics and/ or decisions, there’s also a lot to be said for making sure our foundations are sound. Below are five keys to making Big Data work and avoiding the pitfalls of bad data.
Focus on data quality rather than quantity. Not even the most sophisticated analytics can overcome measurement errors, whether that’s noise, drift, or interferences. If you aren’t confident in your primary sensors and analyzers, you could have a lot of bad data that is worthless, no matter what you do with it. For example, a Water Environment Research Foundation (now the Water Environment & Reuse Foundation) decision support system (DSS) project required a research team member to perform data analytics to pick out anomalies that might indicate toxins in plant influent, but distinguishing anomalies due to toxins from anomalies due to measurement problems proved to be a major hurdle.
Confidence in sensors and analyzers can be gained by:
- Cleaning them. Wastewater treatment is an especially fouling environment and not the best place to put scientific equipment. Operators frequently underestimate how quickly sensors become fouled. Go for autocleaning whenever possible and avoid installing anything in raw sewage or primary effluent unless you really need the measurement because both areas are particularly prone to fouling. Mixed liquor is an easier place to take measurements, and final effluent is the easiest place of all. Water treatment systems usually are less fouling, but sensors still need periodic cleaning.
- Calibrating them. This is generally understood, although the frequency of calibration, particularly for sensors that tend to drift, typically is shorter than ideal.
- Validating them. This may be the action overlooked by most instrumentation suppliers. Analytics to validate the measurements, particularly during calibration, frequently need more attention.
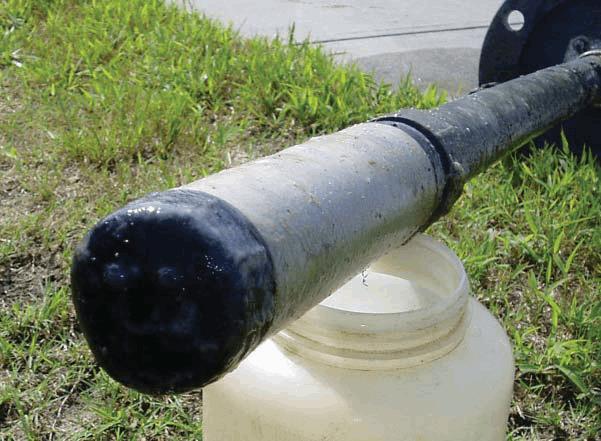
Modern instruments are more reliable than they were in the past, but they still need to be cleaned and taken care of.
Measure only what’s useful to you. What will you actually use to best manage the plant? Some treatment plants lack important and basic measurements (e.g., DO in the aeration basins, airflow to each aeration zone, and electricity use by blowers), but we need to be careful in our enthusiasm not to swing to the other extreme and take measurements that are not especially useful. You can spend serious money measuring ammonia and nitrate all over a treatment plant, but unless you’re actually using it for control, the measurements will eventually be ignored and the instruments neglected. It’s best to have a handful of good instruments, positioned in locations where you’re actually measuring something you can control, and to try to keep those sensors running well.
Think dynamics, not steady state. A lot of the design and operational guidance in textbooks and training materials has simple equations into which you plug a single number to get your answer (e.g., sludge age calculation or removal efficiency). Similarly, influent and effluent samples are usually flow-weighted or time-averaged composites. We’re used to thinking and talking about average daily conditions. However, the reality is that our treatment plants see significant daily variations in flows and concentrations, and therefore we need to look at them as dynamic systems. For example, an online phosphate analyzer taking measurements at the end of the aeration basin just prior to the clarifiers might reveal daily phosphate peaks of 1 or 2 mg/L every afternoon for just an hour or so, but the effluent composite sample measurements could be consistently below 0.2 mg/L. To understand our treatment systems, we need to measure and analyze their dynamics.
Recognize different timescales. Hand in hand with dynamics is the need to think about different timescales: diurnal (daily) variations, weekly trends (especially weekend versus weekday differences), and seasonal shifts. For each of these, the data analytics needs are quite different and need to be carefully considered. For diurnal variations it can be useful to compare one day to the next by overlaying the dynamic data. For weekly trends we can do something similar over a sevenday horizon. And for seasonal shifts it is often beneficial to plot and compare long-term trends to temperature and maybe rainfall shifts.
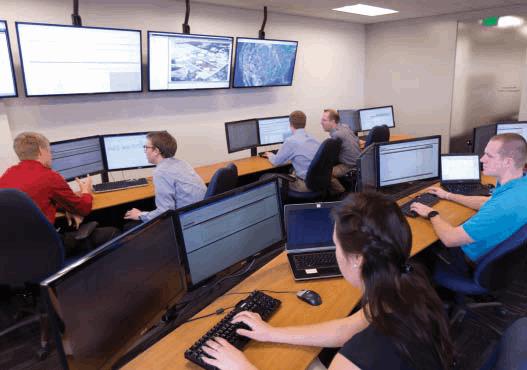
Tools such as Black & Veatch’s ASSET360 system help water utility managers follow in the footsteps of their energy utility colleagues to harness data for improved decisions and operations.
Consider how to handle outliers and extraordinary events. In data analytics it’s common practice to identify and eliminate outliers, assuming they’re either bad measurements or not typical and therefore something to ignore. But experience shows that a lot of what is done at water and wastewater treatment plants is trying to keep the process stable in response to abnormal events, such as upsets from shock loads or toxins, or, more typically, responding to wet weather for wastewater plants or major line breaks or droughts for water treatment. We need to identify outliers, but rather than throw them away, we need to decide how to respond.
In a nutshell, Big Data is about taking all the data we now have at our fingertips and turning it into knowledge that we can apply to operate our treatment facilities better. The right data, analytics, and decision framework can drive water (and energy) utilities to optimal performance.
About The Author
 Andy Shaw, Ph.D., is a global practice and technology leader with Black & Veatch. He is responsible for wastewater treatment and sustainability and has special expertise in instrumentation and computer modeling. He is also a keen user of internet-based knowledge transfer, including his blog http://poopengineer.blogspot.com/. Shaw has led or served on multiple WEF committees and was featured in a WEFTEC 2016 Water Online radio interview about Big Data.