
Transform Holistic Watershed Management Through Digital Solutions
By Ting Lu and Jeff Van Note

A data-driven utility culture is forward-looking in more ways than one, leveraging the latest technology to protect water resources for years to come.
Clean Water Services (CWS) is a special service district that provides wastewater treatment, stormwater management, and watershed management, serving nearly 600,000 customers in Washington County, Oregon. Like other utilities, CWS is facing water resource management challenges, extreme weather patterns such as drought and flooding, stringent permit requirements, population growth, and aging infrastructure. CWS is applying technological innovation where practical to create solutions for these pressing problems. CWS has embarked on this journey with the goal of uncovering dark data, implementing digital solutions, and providing quantitative decision support for utility management in all aspects. However, a holistic implementation of successful digital solutions is more than just technology. This paper demonstrates that CWS’s documented progress was achieved by integrating people, process, and technology, with special emphasis on our people and our customers.
Cultivating a culture that supports data-driven decision-making and transparent knowledge-sharing is crucial to support the Digital Solutions of the Future initiative at CWS. To begin this transformation, the Data Management Hub was established in 2016 to provide a collaborative space for business analysts, process engineers, and business leaders from various departments (including Operational Technology and Engineering Technology) and the software engineers and program analysts from the Information Technology Division to integrate. The team meets monthly to discuss and provide updates on data-related activities and learn about the latest technologies such as artificial intelligence, virtual reality, and storyboards. Awareness of these is useful when teams explore innovative technologies. In addition, hub members have a better understanding of what other members are working on.
The culture change has produced more efficient and holistic results. Dark data started to become uncovered and leveraged to provide more value for Clean Water Services. For example, the initial use of sewer system monitoring is to inform sewer cleaning and sewer replacement capital projects. Through collaboration, the use of data has been extended to our Source Control group to provide real-time flow data to track slugs of flow discharged from industries and inform wastewater treatment and recovery operations to prevent upsets. In addition, a stream flow portal (Figure 1) was developed integrating real-time flow sensor data, plant SCADA data, and water storage information to serve as a communication tool that summarizes the information used to manage stream flow and illustrate how Clean Water Services provides ecological uplift through flow management in the Tualatin River. The technologies used to achieve this were custom integration processes written with Python, ESRI’s ArcGIS Enterprise to build mapping services and applications, and Microsoft SQL Server used as the back end for data storage. The custom integration process’ data sources include iHistorian for wastewater treatment facility (WWTF) effluent, SharePoint for reservoir withdrawal and tributary flow augmentation information, and real-time flow sites supported by United States Geological Survey (USGS) and the Oregon Water Resources Department (OWRD). To further unleash the potential of this data, it is also used to inform decisions on tributary flow augmentation, wastewater operation optimization, and stormwater real-time control facilities. Maps and services allow users to view river flows, releases from reservoirs, tributary stream flow augmentation, and effluent volume from treatment plants, as well as a calculation of what percent of flow is from each source.
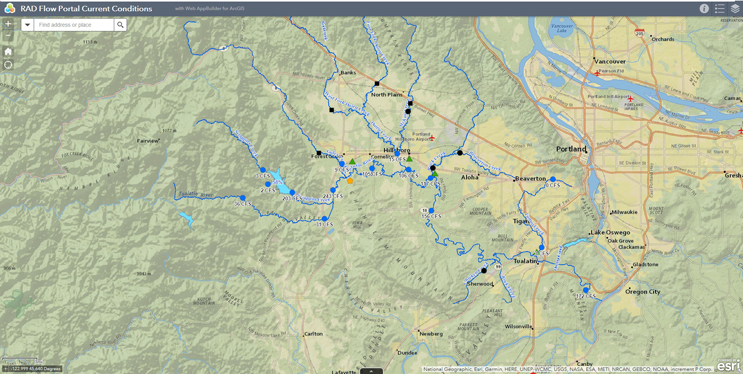
Figure 1. A snapshot of flow portal
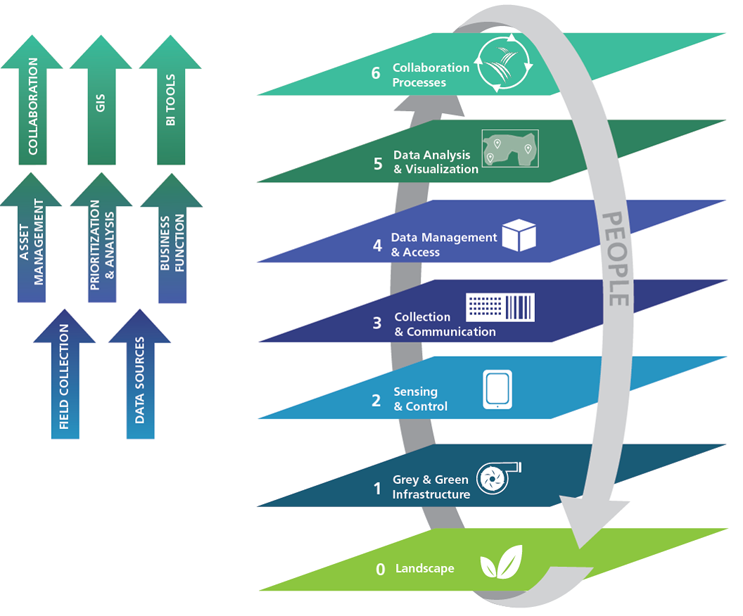
Figure 2. The Clean Water Services Knowledge Development Model (KDM)
The Clean Water Services Knowledge Development Model (KDM), shown in Figure 2, was inspired by the SWAN Interactive Architecture Tool and helps explain how water industries can leverage the IoT to develop valuable knowledge about their watershed. Digital Solutions started from Layer 2 to Layer 5. Collaboration between District staff and partner agencies and organizations are captured in the highest level of the KDM. Internal and external stakeholders from across the watershed work together to understand engineered and natural systems and measure the effectiveness of the organization’s current practices and initiatives. A deeper knowledge of the watershed is developed from the effect of District efforts and are repeatedly measured and re-evaluated by stakeholders. Over time, this knowledge becomes foundational to the continued improvement of the organization’s operations and business towards watershed health.
GIS data management, analysis, and visualization are distributed within the District. Digital Solutions ensures that GIS databases and software are up-to-date and working for users, integrates GIS with other business systems, automates data processing workflows, and may assist with some data import and management tasks. GIS analysts typically work within their departments to perform in-depth data analysis and reporting, create geographic products, and import and manage datasets specific to their user bases. To better achieve holistic watershed management, an integrated planning portal was developed to overlay information related to geomorphology, environment, and engineering planning perspectives from multiple sources. It is designed to be easily adapted to new requirements, broadly accessible to District users for integrated planning strategy and watershed assessment, and flexible enough to allow addition of information needed by planners and decision-makers.
There are approximately two dozen layers related to environment, and a dozen each for geomorphology and planning, as well as a few common layers. The integrated planning portal was built with ArcGIS Enterprise. The current process uses ArcGIS Pro to publish layers, mostly stored in an enterprise geodatabase, but some in file shares. The District has updated its environment to support hosted layers, which will allow GIS analysts to manage information and publish directly to the server. Phase 2 of the integrated planning portal will use this technology.
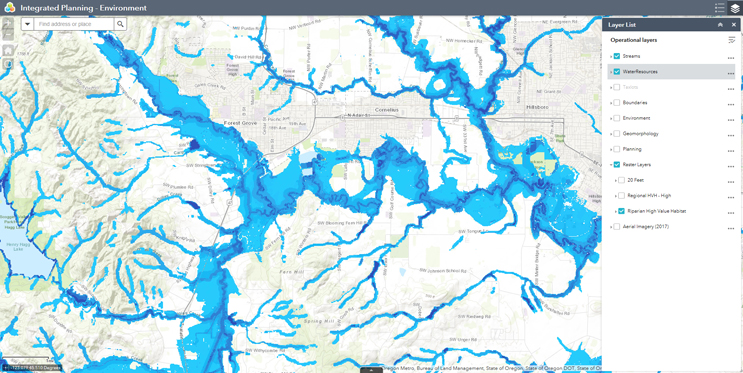
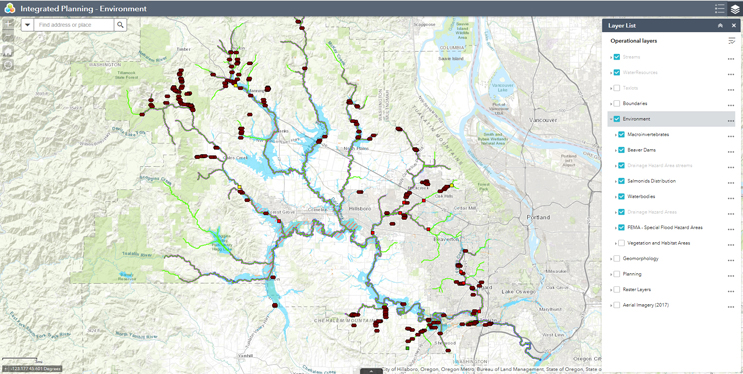
Figures 3/4. Snapshot of Integrated Planning Portal used for integrated planning effort at CWS
Since 2007, CWS has begun exploring the use of remote sensing technologies, including Lidar and unmanned aircraft systems (UAS) with multi-spectral imagery to guide stream restoration project planning, construction, and maintenance for watershed management. Compared with the traditional densiometer approach to measure project shade, the use of remote sensing technologies provides more consistent and accurate measurements of stream restoration project performance (Figure 5). In addition, UAS technology allows for the monitoring of additional project-specific information, including stream storage, soil moisture information, impervious surfaces, and invasive species control. This big data introduced from imagery analysis opens a new era of watershed characterization with quantitative and granular information on a watershed scale to aid integrated planning efforts and develop cost-effective solutions. Today, the District staff is exploring using machine learning and open source tools to harness the power of data analytics for watershed monitoring and generate granular information about land use for watershed management.
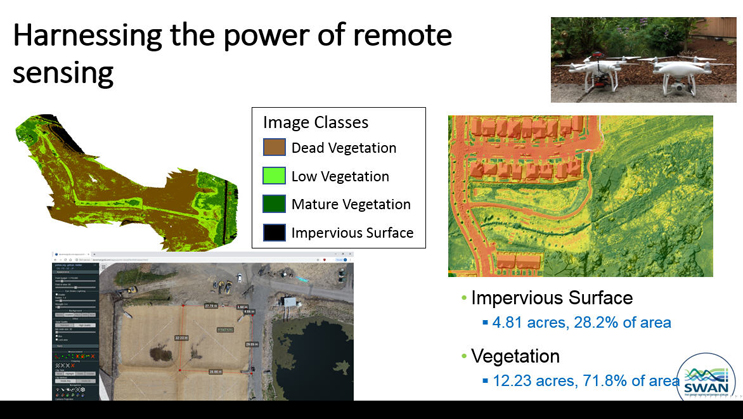
Figure 5. Remote sensing data for a stream restoration project
In summary, there has been much progress in moving toward the Digital Solutions of the Future at Clean Water Services. As a result, staff has been utilizing more data to support holistic decision-making for both long-term planning and proactive operation and maintenance levels. Based on our experience, the initial acceleration of digital solutions should be focused on three areas:
- Cultivate a data-driven culture and develop an integrated framework.
- Align digital solutions transformation with the organization’s mission and vision, in this case, to achieve CWS’s ecological uplift through holistic watershed management.
- Develop a digital solutions ecosystem that integrates information technology (IT), Operational Technology (OT), and Engineering Technology (ET) together.
Ting Lu is the Business Practice Leader, Digital Solutions at Clean Water Services, which treats 65 million gallons of wastewater each day for over 600,000 customers in urban Washington County, Oregon. Ting oversees the day-to-day activities of the team responsible for digital solutions implementation and integrating IT Operational Technology (OT) and Engineering Technology (ET). She holds PhD and MS degrees in Environmental Engineering from the University of Cincinnati.
Jeff Van Note is Digital Solutions Opportunities Manager at Clean Water Services and has worked in the utility industry for over 20 years. Jeff specializes in business intelligence, geographic information systems, integration, and application of technology to business initiatives. His current focus is expanding Clean Water Services’ use of analytics tools and integrating operational technology to support data-driven decision-making.