
SWAN Corner: Wet Weather Measurement Means More Than Scratching The Surface
By Jay Boyd

A Brief History Of Flow Measurement
History reveals that measuring water levels goes back many thousands of years to ancient Egypt. The Nile River was the source of life for the Egyptians, vital for sustaining life in Egypt. It was the annual flooding of the Nile that brought water to the erstwhile parched landscape for crop irrigation.1 Flooding would vary from year to year, and hence the Egyptians recognized that they could predict the harvest bounty based on Nile River levels. They developed methods and structures to measure river levels with their predictor called “Nilometers”2. Some of these structures survive today.
Many cities throughout history were established on rivers because of an abundant and ongoing supply of water. Thus, measurement of levels and flows, as with the ancient Egyptians, was important to understand. Over the span of 3,800 years, humans developed methods for measuring river levels and flow. By the mid-nineteenth century, science sought more exacting measurement. A number of flow calculation methods started to emerge. It was Robert Manning that had perhaps the greatest impact. In 1889, Manning “first proposed his formula to the Institute of Civil Engineers (Ireland)”3. Manning’s Equation was adopted over the next two decades and became the standard for velocity calculation in open-channel flows.
In the mid-1970s, technology was applied to achieve a more accurate and direct velocity measurement; one that could quickly and repeatably measure flow volume. This new technology was termed area/velocity (A/V) metering. It was used to measure flows in open-channel (gravity) sewers, including sanitary, combined, and storm systems. The method for measuring flow was expressed as Q = VA where, “Q” is flow, “A” is cross-sectional area, and “V” is velocity.
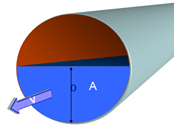
Diagram 1: Illustration of the two essential measures of flow. “A” is the cross-sectional area and “V” is velocity.
These meters quickly became the preferred technology for their accuracy and repeatability. Over the course of the past 45 years, this technology has undergone continuous innovation, development, and refinement of the meters, sensors, data logging, telemetry, software, and analytics.
Today, A/V meters are well established for their reliability and accuracy. They are the standard for measuring open-sewer flows. Moreover, software has been transformed from a means to compile data to a resource that informs and makes recommendations. Leaders in this field take advantage of artificial intelligence and machine learning.
The Challenges Of Wet Weather
Wet weather is a continuous concern for wastewater utilities. Rain-derived infiltration and inflow (RDII) challenges the collection system capacity. It can potentially result in overflows in the collection system and even the wastewater recovery facility (WRF) in extreme cases. These overflows can threaten public health and the environment. Additionally, higher flow volumes associated with wet weather will increase operating costs at the WRF. Effectively, the increased volumes at these facilities mean that they are wastefully processing rainwater. To understand RDII impact, utilities across the U.S. will spend hundreds of millions of dollars annually to identify inflow and infiltration (I/I) sources in the collection system. Engineers will typically target suspect areas, usually within a given basin, and then pinpoint locations for installing A/V meters as well as rain gauges. These remote-site monitoring systems will acquire and communicate data, typically to a cloud-based system. Users have access to data and analytics via web-enabled devices.
Over the past few years, depth-only monitors (DOMs) have been promoted as a less expensive alternative to A/V meters for measuring RDII. Their lower per unit cost and purported ease of installation give reason for utilities to see them as an alternative, especially if they have tightly constrained budgets. These savings can range from 30 to 60 percent per meter.
Depth-only monitors, as their name implies, only measure depth and not velocity. To satisfy the flow equation of Q=VA, some of these devices employ Manning’s Equation, substituting for velocity (V). Others use proprietary algorithms to arrive at velocity. At face value, this approach seems to have merit. In the case of Manning’s Equation, it has been used for more than 100 years. Moreover, with the initial cost savings of DOMs for assessing I/I, as opposed to A/V meters, they can be alluring to tackle I/I assessment to those with a limited budget.
Manning’s Equation is expressed as:
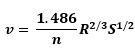
Where
- n is the Manning co-efficient of roughness (boundary resistance),
- R is hydraulic radius (cross sectional area of the pipe),
- S is slope (of the grade).
In theory, if these variables are known, then Manning’s can satisfy for velocity (V). However, in a sewer, this becomes challenging. Take, for example, n, in sanitary sewers. This value can be accessed through tables that are found easily in engineering texts and the internet. Tables will list pipe material — i.e., ductile iron, and provide a corresponding n value. Sometimes they provide a range of values based on estimated pipe condition. Obviously, being subjective, the pipe condition is an estimate. Additionally, there are other assumptions that must be made, including that the hydraulic radius is consistent and that the slope does not vary. Under ideal conditions Manning’s error is ±20 percent, at best. Yet, few sanitary sewers have ideal conditions creating substantial opportunity for increased flow measurement error, calling DOMs monitoring ability to accurately measure flow into question.
Comparative Test Of A/V Meters To DOMs
To better understand DOMs, multiple studies were conducted to measure their accuracy and to determine whether they are suitable to measure flow. In the first study, A/V meters were placed at either end of a main pipe (Manhole M1 and Manhole M2 per Diagram 2). Depth-only monitors were placed on four laterals. The flow difference between the upstream A/V meter M1 and the downstream A/V meter M2 was 0.146 MG. Yet, the sum of all the four depth-only devices was 1.023 MG. The depth-only monitors were 701 percent higher than the actual, directly measured value by the A/V meter. What made the difference was a backwater condition caused by an obstruction (X) as per Diagram 2. The backwater condition caused the upstream water levels to increase and resulted in the DOM’s highly overstated calculated flow.
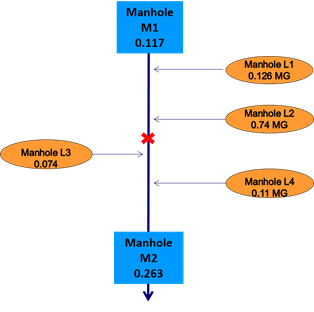
Diagram 2: Two A/V meters (blue square) for depth-only monitors (orange oval).
Red X obstruction.
In another study, backwater again played a significant role resulting in a wide differential of A/V vs. DOM flow results. A site was measured during an RDII event where a significant increase of depth (blue hydrograph line) showed an 8X increase, whereas the flow (green hydrograph line) only showed a 1.4X increase. If depth-only were used on this site to determine effects of RDII, it may have been determined that there was a significant issue and that capital funds needed to be prioritized to this location.
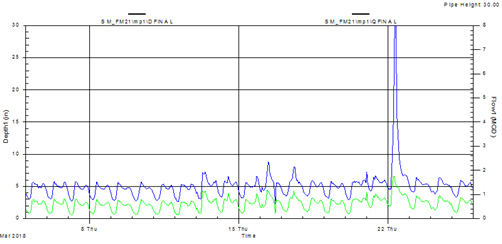
Hydrograph 1: Depth-only (blue) compared to flow (green).
In a third example, we see the effects of slope on the apparent outcomes. This hydrograph shows a decrease in depth (blue hydrograph line) while, in fact, the flow nearly doubled at this location. What happened in this case was that increased flow was accompanied by shallower and faster (higher velocity) flows. The depth-only monitor detected the decrease in depth but was blind to velocity. If using depth-only monitors, this site would be erroneously ignored as having no RDII issue when, in fact, there was a 75 percent flow increase.
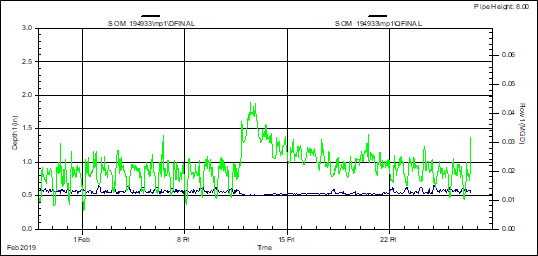
Hydrograph 2: Depth-only (blue) compared to flow (green). Depth appears to go down while flow actually increases.
These three illustrations (above) provide evidence that DOMs may not be suitable for measuring the impact of RDII. In yet another test, 10 sites that had 10-plus years of data from A/V meters were compared to those same sites using depth-only and Manning’s. In the chart below, the blue column represents average flow data for the site. Using depth-only data and calculating flow from it, the orange column shows the calculated average flow values. The green columns show the net difference of A/V versus depth-only and the net difference variance as a percentage. Of the 10 sites, the site with the least variance was JH3 with a -27 percent variance. The worst site was A2B with -77 percent.
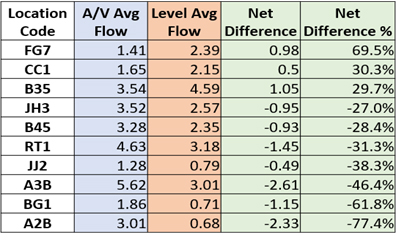
Chart 1: Comparison of averaged A/V meter flow data versus calculated average depth-only data.
Closing Thoughts And Takeaways
These studies tend to raise questions concerning the effectiveness of DOMs for determining flow. More importantly, if capital improvement project (CIP) decisions rest on data and analysis, then decision-makers must be assured that they are acquiring accurate information and drawing sound conclusions. Just in the cases above (and others not cited), DOMs error in all cases was substantial.
In many hundreds of I/I mitigation projects, if a utility can achieve a 30 percent reduction, it is considered a success. In these studies, alone, at best, the error was nearly 30 percent, and more often greater. Sometimes, utilities may not believe that accuracy is important where “just a relative comparison” is sufficient. Yet, as shown in Chart 1, variances can be both positive and negative. Therefore, even this approach can be tenuous for these factors:
- How can it be known whether the two locations have error?
- If they do have error, how much?
- If they do have error, in what direction (negative or positive)?
The final consideration is cost for I/I mitigation. Utilities can spend thousands or even tens of thousands of dollars to identify I/I locations. As stated, DOMs do offer a way to lower this initial cost. Yet, I/I mitigation also involves CIP costs where they can be 10X to 100X more costly than the initial metering and assessment. In other words, making an investment predicated upon an error-prone method substantially and irrevocably costs much more. By contrast, an investment to acquire accurate data and make supportable, fact-based decisions can yield the returns that a utility seeks.
References
- National Geographic, Nick Romeo, 18 May 2016, https://www.nationalgeographic.com/history/article/160517-nilometer-discovered-ancient-egypt-nile-river-archaeology
- www.waterhistory.org
- H2O Metrics, https://h2ometrics.com/manning-equation. March 28, 2018
Jay Boyd is the Director of Market Development for ADS Environmental Services. Over his career of 39+ years, he has focused on technology and business development with particular focus on process optimization. Through this experience, he has guided development and introduction of numerous innovations to the market. In addition to Jay’s undergraduate degree in Biology, he has extensively engaged in graduate studies in both business and technology. He is a member of the Water Environment Federation (WEF), the WEF Intelligent Water Technology Committee, and the California Water Environment Association. Based in San Diego, he works throughout the U.S. and Canada with water districts, municipalities, and consulting engineering firms.
SWAN, the Smart Water Networks Forum (SWAN), is the leading global hub for the smart water sector. A UK-based non-profit, SWAN brings together leading international water utilities, solution providers, academics, investors, regulators, and other industry experts to accelerate the awareness and adoption of “smart,” data-driven solutions in water and wastewater networks worldwide. Learn more at www.swan-forum.com.