
SWAN Corner: From Age-Based To Performance-Based — Constanta's Digital Transformation In Water Meter Management
Authors:
Rui Malheiro, Pedro Ramalho, José Miguel Maia, Miguel Zilhão, Daniel Faria, Ana Rita Santos, and Bárbara Barbosa – AGS Water Solutions;
Petrica Talpalaru, Iulian Andrei, Adrian Florea, and Mihaela Pocora – RAJA SA
Most water utilities worldwide face significant challenges in reducing non-revenue water (NRW), frequently impeded by operational inefficiencies and resources shortage. Romania's largest public water company, RAJA SA, faced similar obstacles and embarked on a transformative initiative in the city of Constanța. In partnership with AGS Water Solutions, RAJA implemented a performance-based service contract (PBSC) for NRW management and adopted innovative digital tools to support the new integrated water meter management approach. This initiative offers valuable insights for utilities seeking to scale digitalization and improve operational efficiency.
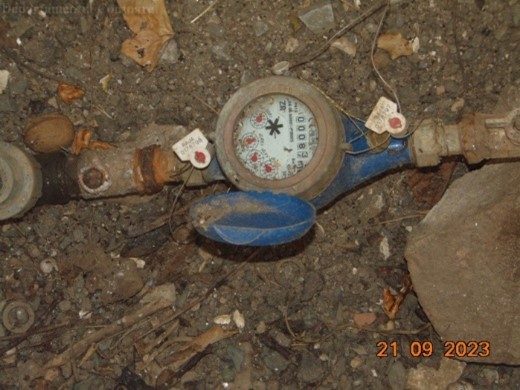
Figure 1. Example of old meter — RAJA, Constanta
Customer meters were traditionally replaced due to obvious malfunction or age, often without assessing performance. Meter readings were initially handwritten on paper and later copied into a database for billing, while the meters cadastre remained outdated. The PBSC shifted these obsolete practices to a data-driven approach, integrating data from multiple sources and prioritizing replacements through cost-benefit analysis at every meter.
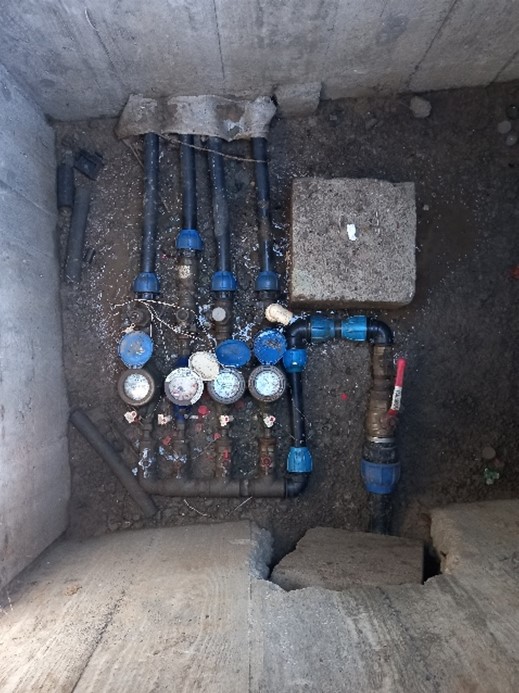
Figure 2. Example of meters installed in Constanta
Overcoming internal resistance to change was one of the most significant early challenges. Many staff believed their utility’s situation was too unique for external solutions. Extensive training and capacity-building helped align teams with the new approach, but it was only when initial meter replacement studies showed clear consumption increases that a real buy-in was achieved. This practical, evidence-based validation helped shift perceptions, enabling further adoption of other best practices like large customer meter resizing.
Employees were encouraged to fully comprehend meters’ potential to address utility inefficiencies, starting with metering errors. Meters began to be analyzed considering their unique operating conditions and degradation rates influenced by factors like water quality, consumption patterns, recorded volume, brand, size, technology, and environmental conditions.
Complementing the cultural shift, the utility completed a full transition to a digital system, covering all operations from meter reading to billing. Previously relying on paper-based processes, the databases suffered from inconsistencies, duplicate records, outdated information, and fragmented data across multiple platforms. Consolidating and digitizing these sources was fundamental for real-time decision-making, while significantly improving operational efficiency for the utility's workforce. Integrating telemetry data, meter-reading applications, and customer databases into a centralized platform enabled continuous data analysis. Advanced algorithms now process this data daily, identifying meters requiring replacement, resizing issues (oversized or undersized), renewal needs, potentially blocked meters, or with data reliability problems. Each meter replacement is then automatically prioritized based on its financial and operational impact.
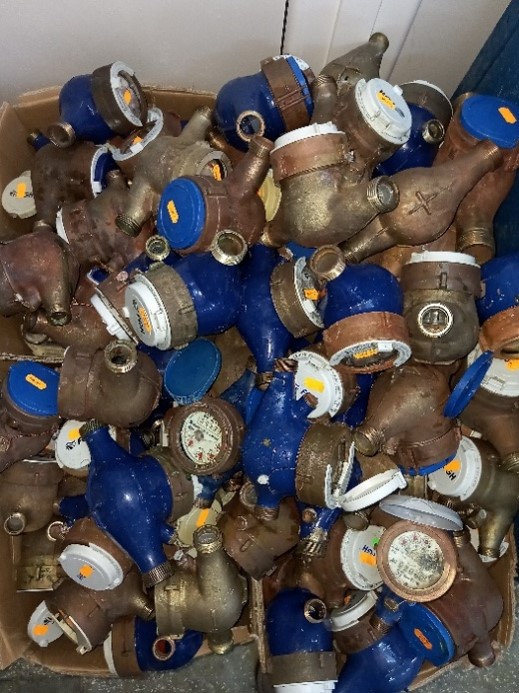
Figure 3. Example of customer meters replaced
A rigorous meter testing program provided RAJA with a level of knowledge into customer meter behavior that few utilities possess. Using its certified testing laboratory, RAJA followed the meter-testing protocol based on Integrated Water Meter Management (Arregui, Cabrera Jr, & Cobacho, 2006). The test sample was designed to be representative of the meters installed in the city. A total of 325 single jet meters — representing the most common metering technology and diameters (DN15, DN20, and DN40), 87% of the meters installed — were tested. The tested brands (Itron, Zenner, Fluid Group Hagen, Contor Group, and Actaris) represent 96% of the meters in the field. Samples were also representative in terms of meter age and recorded volume. A group of brand-new meters was tested to establish the initial metering error.
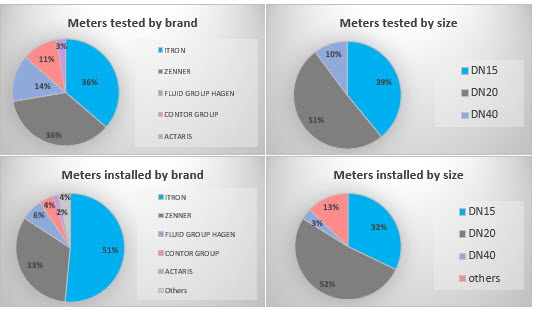
Figure 4. Representativeness of the same in terms of meters tested vs. meters installed in the network
These meters were tested under typical operating conditions at nine flow rates — starting flow, 15, 30, 60, 120, 200, 680, 1500, and 3000 liters per hour (L/h). Each meter was tested three times to improve results reliability. The resulting measurement errors were analysed in relation to the customer consumption patterns, allowing for the calculation of an average metering error to each meter. A weighted error was computed for each age group, starting with new meters to establish the initial metering error, and extending to subsequent years to determine the degradation rates over time.
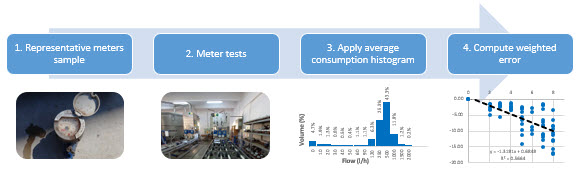
Figure 5. Process to obtain meter weighted error
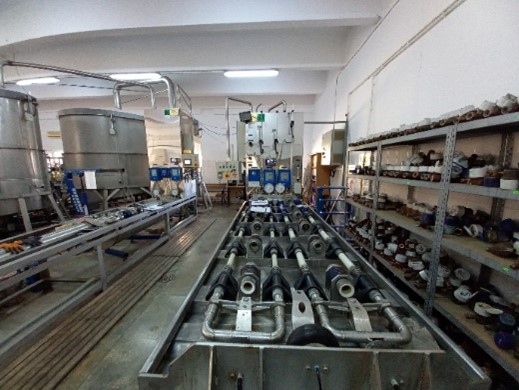
Figure 6. RAJA meter test bench 1
The meter testing results revealed both expected patterns and insightful conclusions. One key observation was that starting flow rate — an important indicator of the meter accuracy — increased with both totalized volume and the age of the meter. These two factors, often interlinked, as displayed in Figure 4, are critical when planning replacements. Smaller meters (DN15 and DN20) were more susceptible to accuracy degradation under similar volume recorded compared to larger meters. Among the DN15 group, most meters began registering flow between 10 and 15 L/h, followed by those in the 6 to 10 L/h range. DN20 meters, mostly began measuring flow between 10 and 15 L/h, followed by 15 to 20 L/h. In contrast, the DN40 meters displayed significantly higher thresholds, with most only beginning to register flow at rates above 50 L/h.
Meters for each diameter were grouped by age, with each group represented by an average data point in the charts shown below.
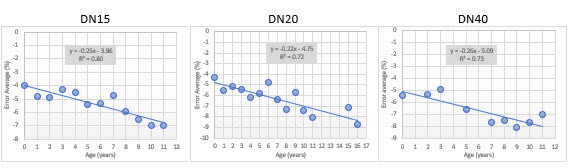
Figure 7. Error average by age from tested meters
For DN15 meters, 127 units were tested, the linear regression indicated strong confidence in the results (R² = 0.80). The initial error was -3.96%, with an annual degradation rate of -0.25%. For DN20 meters, 165 units were tested, and the regression yielded a confidence level of R² = 0.72. The initial error was slightly higher than for DN15 at -4.75%, and the annual degradation rate was -0.22%. DN40 meters had the smallest sample size (31 units), with limited data for newer and older meters. Still, regression analysis delivered a reasonable R² of 0.73, with an initial error of - 5.09% and an annual degradation rate of -0.26%. An additional checking of results was carried out by comparing them with tests conducted by other water utilities in Portugal and Chile where AGS is currently working. The performance of both DN15 and DN20 meters in RAJA Constanta showed strong alignment with the findings from other companies.
While the results were consistent and aligned with international utilities, some age groups, for instance one and four years, especially among DN40 meters, had smaller sample sizes, limiting statistical confidence.
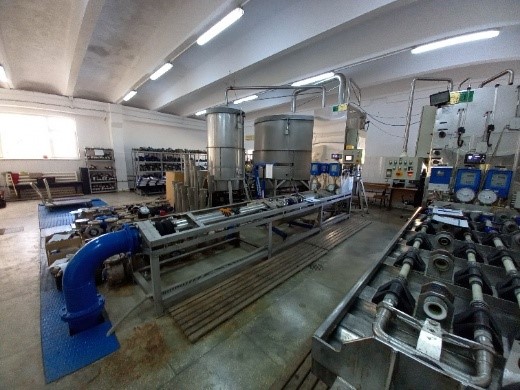
Figure 8. RAJA meter test bench 2
Early observations by brand and model performance were also inconclusive due to sample constraints. Ongoing and expanded testing will help solidify these comparisons and support a more accurate performance ranking of installed meter models.
The data obtained from meter testing were used to calibrate predictive algorithms within the Meterwise software — AGS’ software for integrated customer meter management based on the above-mentioned methodology. By applying initial error rates and degradation patterns, Meterwise analyzes consumption trends and recommends the optimal time for each meter's replacement or resizing. This ensures meters are only replaced when the accuracy loss justifies the cost of replacement — minimizing revenue losses while maximizing investment efficiency.
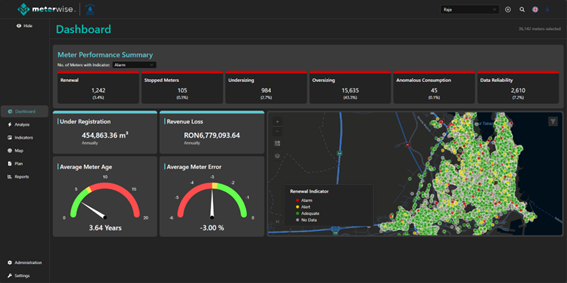
Figure 9. RAJA Meterwise dashboard — integrated meter management software
As RAJA continues building on this knowledge, targeted testing of specific meter groups is expected to bring more precise insights, particularly regarding how error progression varies between specific meter models. This ongoing analysis will support more informed decision-making on meter acquisition and replacement strategies.
With greater confidence in meter behaviour, RAJA is also strengthening best practices on quality control. New meter acceptance protocols are being discussed for future tenders. Additionally, the utility plans to conduct consumption histogram studies, which are essential to calculate weighted meter errors by customer type.
By prioritizing cost-effective meter replacements, the utility improved billing accuracy for 17,000 meters. As a result, the global customer meter error decreased from -4,68% in 2022 to -2.77% by the end of 2024. This significant improvement in meter accuracy led to higher-billed consumption among customers with replaced meters, generating additional revenue to support efforts in reducing both physical and apparent losses. Resizing over 150 large customer meters, especially for old customers with different consumption needs, delivered significant gains. These targeted actions, guided by cost-benefit analysis, improved billing accuracy and water balance reliability, directly contributing to NRW reduction.
This experience demonstrates that global replacement approaches often overlook individual meter variability caused by local conditions and customer behavior. Investing in reliable data systems is essential for informed, cost-effective decision-making.
RAJA’s journey illustrates how integrating people, processes, and technology can transform utility operations. Their PBSC experience highlights the importance of challenging outdated practices and using reliable data to drive cost-effective decision-making. Through innovation and strong internal alignment, RAJA is building a sustainable model for NRW reduction that other utilities can follow.
SWAN, the Smart Water Networks Forum (SWAN), is the leading global hub for the smart water sector. A UK-based non-profit, SWAN brings together leading international water utilities, solution providers, academics, investors, regulators, and other industry experts to accelerate the awareness and adoption of “smart,” data-driven solutions in water and wastewater networks worldwide. Learn more at www.swan-forum.com.