
Survey Reveals Water And Wastewater Billing Stats And Concerns
By Rocky Craley and Catherine Carter
With infrastructure reliability on the brink, utilities are forced to raise rates to fund improvements. It’s not a move that is undertaken lightly, nor should it be. The latest AWWA rate survey, produced with Raftelis Financial Consultants, highlights the plight of both utilities and consumers.
Clean water represents one of the most basic and essential human needs. When setting rates, utility financial professionals have a lot on their minds — meeting debt service requirements, ensuring sufficient funds to support operations and maintenance needs, and building reserves for future activities. Unfortunately, the infrastructure costs associated with providing water service have increased substantially over the last 50 years, causing increases to water rates and ultimately customer bills. In considering the utility’s pricing objectives, however, ensuring adequate revenues to support water service is increasingly causing affordability concerns for residents.
This article utilizes the results of the 2016 Water and Wastewater Rate Survey (Rate Survey) and previous surveys to consider how utilities have responded to the tension between revenue sufficiency and affordability. Beginning with a longitudinal look at water and wastewater rate and bill trends, rates have increased nationally and regionally at a rate greater than the Consumer Price Index (CPI). From there, the authors explore current day drivers, such as affordability, and discuss the potential customer impacts of the ever-increasing water bills. These trends will be considered within the contexts of both geographic regions and utility size.
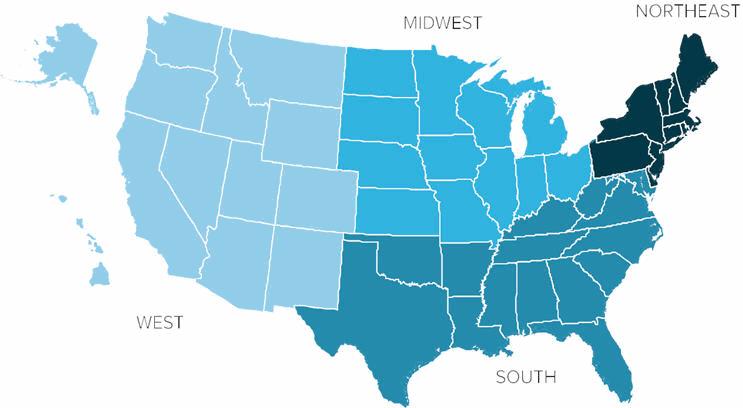
Figure 1. Regions included in the 2016 Water and Wastewater Rate Survey
Data Source
Using rate data from the biennial Rate Survey, which has been coproduced by the American Water Works Association (AWWA) and Raftelis Financial Consultants, Inc. (Raftelis) since 2004, this article considers rate trends on both the national and regional level. The Rate Survey series is one of the most recognized compendiums in the industry and provides information on utility characteristics and charges for a diverse and meaningful sample of U.S. urban, suburban, and rural systems. Analyzing rate trends at a regional level helps utilities to identify appropriate peer organizations, in terms of size, geography, regulatory requirements, and other factors, which ultimately provides a higher-quality comparison. The regions included in this analysis are defined in Figure 1.
The Rate Survey series also categorizes water utilities by size into three groupings: Group A, which includes utilities with water sales of more than 75 MGD; Group B, which includes utilities with water sales of between 20 and 75 MGD; and Group C, which includes utilities with water sales of up to 20 MGD.
National And Regional Rate Trends
Water rates are trending upwards on both the regional and national scale. Rates have increased across the board since 2006, and the magnitude of rate increases tends to outpace the CPI. Figure 2 demonstrates the annual increase for a typical residential customer in national and regional rates. Rate changes represent rate increases from 2006 to 2016, based on the change in median monthly bills for residential customers with 5/8” meters and monthly consumption of 1,000 cubic feet of water. Figure 2 shows rates in the West have changed the most by percent (an increase of 117 percent between 2006 and 2016), while rates in the Northeast have increased the least by percent (an increase of 28 percent between 2006 and 2016). For reference, the CPI increased by 19 percent during this timeframe.
Water rates are also trending up for utilities of all sizes. Figure 3 demonstrates the trend of median monthly bills by utility size.
Water Bill Affordability By Region
The median household income (MHI) by utility size tends to be less variable than the regional MHI, with a range of only approximately $3,000 between the highest income systems (Group B), and the lowest income systems (Group A) in 2016. However, as demonstrated in Figure 5, in 2016, individuals getting bills from the smallest water systems (Group C) paid approximately 33 percent more as a percentage of their income than did those receiving bills from midsize systems. In fact, the midsize utility systems have been the most affordable at the median income level for the last decade.
Interestingly, not only do Group C utilities pay the highest percentage of their income for water bills, but almost 15 percent of the Group C utilities already exceed, or are more than 75 percent of the way to, the EPA’s 2 percent affordability threshold. None of the Group A systems and only 1 percent of the Group B systems are this close to the threshold. This disparity is likely due to economies of scale. Utilities tend to have high fixed costs associated with operating, debt service, and capital improvement programs. Smaller systems have fewer accounts to spread these costs among.
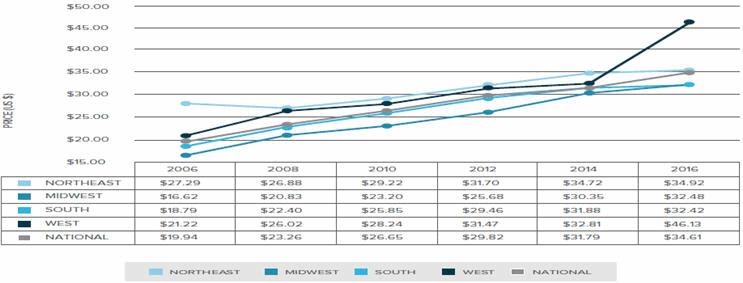
Figure 2. Water rate change of median typical residential customer bill by region
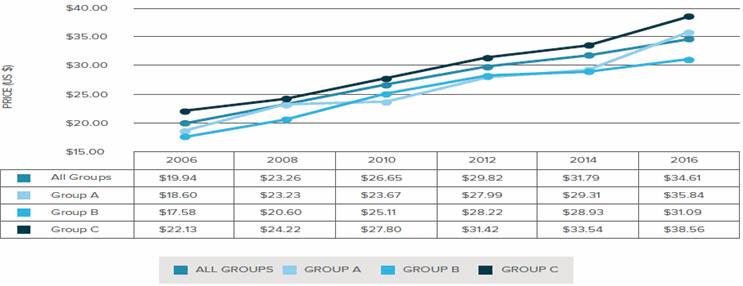
Figure 3. Water rate change of median typical residential customer bill by utility size
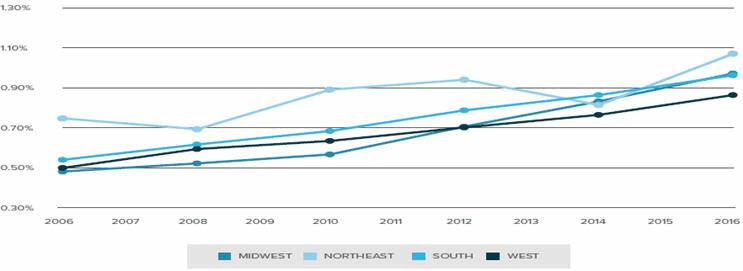
Figure 4. Median water bill to MHI, by region
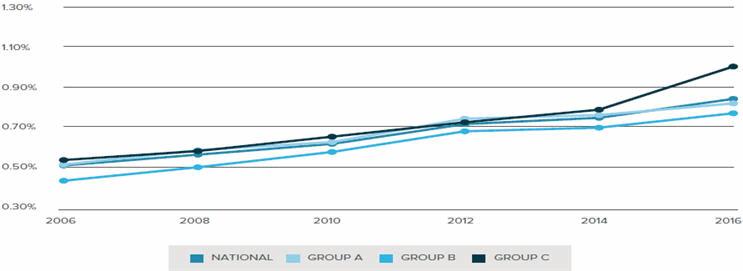
Figure 5. Median water bill to MHI, by utility size
Discussion
Water rates are increasing in all regions and for all sizes of utilities. However, despite having outpaced the CPI for the last 10 years, water bills still represent only approximately 1 percent of most customers’ incomes. Customers of western utilities or midsize utilities tend to spend slightly lower percentages of their incomes on water bills, while customers of northeastern or small utilities tend to spend slightly higher percentages of their income. These trends have been reasonably consistent for the last 10 years, leading the authors to conclude that water service in the U.S. is affordable, based on the 2 percent of MHI threshold established by the EPA.
While this is a positive finding, by definition, 50 percent of participating utilities have water bill-to- MHI ratios that are higher than those shown in Figures 4 and 5. For approximately 3 percent of the survey respondents, water bills already meet or exceed the EPA’s affordability threshold, and another 5 percent of survey respondents are more than three-quarters of the way to the threshold. This is problematic and compounded because 50 percent of individuals have incomes less than the MHI, which drives the water bill as a percentage of income well above the EPA’s recommended 2 percent. For low-income individuals or families, water service has already hit an unaffordable level in many utility service areas.
Many utilities are aware of the challenges faced by low-income individuals in obtaining affordable water service and have put programs in place to assist customers with their water bills. Some examples include payment programs, bill round-ups, low-income or elderly discounts, and partnerships with local or regional nonprofits. Given that water rates are likely to continue to rise due to necessary infrastructure investments, utilities may need to increase their efforts to ensure affordable service to all members of their communities.
References
- American Water Works Association and Raftelis Financial Consultants, Inc. Water and Wastewater Rate Survey. 2016.
- U.S. Environmental Protection Agency. Affordability Criteria for Small Drinking Water Systems: An EPA Science Advisory Board Report a Report By the Environmental Economics Advisory Committee of the EPA Science Advisory. 2002.
About The Authors
 Rocky Craley joined Raftelis in 2008 and currently serves as a project manager. He specializes in water, wastewater, and stormwater finance, with a focus on financial forecasting, cost of service, and rate structure design. Additionally, Mr. Craley also manages Raftelis’ many survey efforts, including the biennial national Water and Wastewater Rate Survey coproduced with AWWA and the INSIGHT Survey produced by AMWA. He is a contributing author for the Fourth Edition of the industry guidebook, Water and Wastewater Finance and Pricing: The Changing Landscape, and for the upcoming update of WEF’s Financing and Charges for Wastewater Systems, Manual of Practice 27.
 Catherine Carter joined Raftelis in 2011 and currently serves as a senior consultant. Her areas of expertise include strategic planning, organizational assessments, performance improvement, and facilitation. She is a contributing author for the fourth edition of the industry guidebook, Water and Wastewater Finance and Pricing: The Changing Landscape, and holds a Master of Environmental Management from Duke University and a Master of Public Administration from the University of North Carolina at Charlotte.