
Solving Uncertainty: Using Big Data To Predict Urban Water Demand

Data-rich utilities have the tools to forecast urban water demand, but some key considerations are often overlooked when creating models. Learn the pitfalls and how to resolve them.
By John Quilty
Urban water demand (UWD) forecasting is an important task that can be utilized by water resources managers to help mitigate consequences stemming from fluctuations in demand and properly respond to water system dynamics at varying scales and lead times, ensuring appropriate operational, tactical, and strategic management of the water system. UWD forecasting can be applied to solve a number of issues faced by water supply system management such as: 1) understanding the dynamics and underlying factors that affect water use; 2) managing and optimizing the operation of pumps, wells, reservoirs, and mains, among other things; 3) developing effective water demand management programs; 4) setting meaningful water rate schedules; and 5) providing information regarding when peak water demand is likely to occur (Adamowski, et al., 2012).
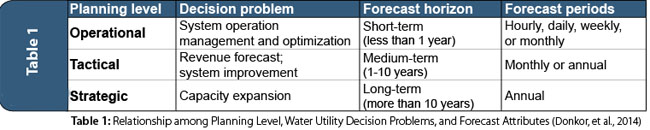
Recently, House-Peters & Chang (2011) explored the UWD modeling literature from the past three decades and identified four themes that are important. In this regard, we discuss two of these topics that are relevant to this article: (1) interactions within and across multiple temporal scales, and (2) acknowledgement and quantification of uncertainty. To understand the broad context of UWD forecasting applications at different scales, Donkor, et. al (2014) summarized their findings related to the planning level that the forecasts can support as the following three categories: operational, tactical, and strategic (presented in Table 1). Most recently, it was identified through a survey of water utilities under the Water Research Foundation’s co-funded project on short-term UWD forecasting (Fullerton, Forthcoming) that water utilities’ most crucial need for short-term forecasting is tied to revenue and expenditure projections. Generally, the most prevalent billing cycles occur at monthly, bimonthly, and quarterly periods.
Undoubtedly, we are operating water systems in the age of Big Data, where sensing technology is prevalent and the ability to store and process large amounts of data are advancing at expedited rates (Courtney, 2014). Furthermore, with advances in the domain of machine learning, data-based forecasting is often used in water resources applications to solve challenging problems with non-trivial mathematical expressions (Maier, et al., 2010). To merge the ongoing advancements in the UWD modeling domain with the forecast requirements of the water utility and the water industry trend of Big Data analytics, it is clear that we require a refined forecasting procedure that is not only accurate and reliable but suitable for Big Data applications. It is essential that this forecasting procedure captures the changing dynamics of the water supply system at multiple scales, identifies sources of uncertainty in derived forecasts, and is amenable to Big Data scenarios (i.e., a method that requires little user intervention and rapid computing potential).
In this article we provide a tool named Multiscale-Bootstrap-Extreme Learning Machine (MBELM) that can be used to solve all of the above-mentioned issues plaguing water resources managers and the water supply systems they manage. MBELM incorporates UWD interactions across multiple temporal scales, quantifies uncertainty in model forecasts, and is perfectly suited to Big Data scenarios. To show the benefits in accuracy and reliability of the MBELM, we apply this model to a real-world dataset from the water supply system in London, Ontario, Canada. In this brief case study, we focus on one-month-ahead UWD forecasts, which can be used as accurate and reliable tools for monthly revenue projections because they align with the water utility’s billing periods (City of London, 2013).
MBELM Background
The MBELM model is a refinement of the model Wavelet-Bootstrap-Artificial Neural Network (WBANN), introduced to the UWD forecasting literature by Tiwari & Adamowski (2013). The authors utilize the discrete wavelet transform (DWT) (Mallat, 1989; Daubechies, 1990), which builds on the well-known Fourier transform, to decompose the original water demand record (time series) into multiple components that each characterize different temporal scales. The DWT captures high-frequency time series components and isolates these components into what are called “detail series” representing the fast-changing characteristics of the original record. Successive “details” may be extracted from the original record. The remaining signal content is called the “approximation” series and generally contains trends and slower-moving time series components. If one were to extract all possible details from the original record, the approximation series would represent the mean of the original UWD time series.
After performing DWT analysis on the original UWD time series, the authors then use a nonlinear machine learning technique, Artificial Neural Networks, or simply Neural Networks (ANN) (Zurada, 1992), to calculate forecasts for each isolated signal (the detail[s] and the approximation series). Finally, the authors use the statistical bootstrap technique (Efron & Tibshirani, 1993) to derive confidence intervals addressing uncertainty in the final forecast.
Our modification to the WBANN method replaces the ANN model with a new machine learning technique called Extreme Learning Machines (ELM) (Huang, et al., 2006). The benefit of ELM when compared to ANN is that ELM can be built automatically without user intervention; the ANN requires significant user intervention with different user settings creating large variations in forecast performance. Another attractive feature of the ELM is the rapid computation time, which is on the order of 50 times faster than to the ANN in our simulations. Thus, the ELM is practical for Big Data applications.
Materials And Methods
First, we will describe the procedure for developing the MBELM, and afterwards we will briefly describe the dataset used in this article. We end this section explaining the data partitioning used to generate the forecasts and how the forecasts are evaluated. We defer theoretical development for the reader to explore in the referenced publications.
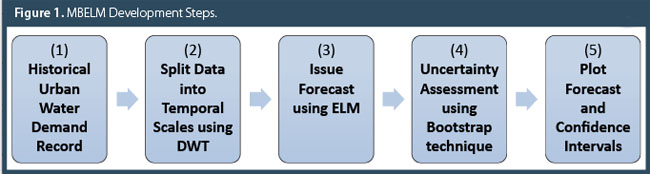
A simple flow chart is provided in Figure 1 to illustrate the MBELM development procedure.
City Of London, Ontario UWD Time Series
In this article we choose a UWD time series from Hipel & McLeod (1994) to present the efficacy of the MBELM. The dataset represents average monthly water demand measured in megalitres per day (ML/D) between January 1967 and December 1988 for the municipality of London, Ontario. This dataset can be used to provide one-month-ahead revenue projections for the water utility.
Data Partitioning
Data partitioning is a method used to build and improve the overall accuracy of the developed forecast model so that it can be used with high accuracy and reliability on new data as it becomes available. When partitioning the data we usually consider three separate sets: calibration, validation, and testing. Validation and testing data are extracted from the original record and reserved to judge the suitability of the model parameters. For the dataset in this article, observations from January 1967 to December 1986 are used to calibrate model parameters; data from January 1987 to December 1987 are used to select the best model parameters (validation); and the best model parameters are tested independently for model evaluation throughout the timeframe January 1988 to December 1988.
Model Evaluation
Using the Coefficient of Determination (COD) and the Mean Absolute Error (MAE), one can evaluate the performance of the MBELM. The COD is a dimensionless quantity (square of Pearson’s correlation coefficient) that describes the amount of variance of the original time series explained by the MBELM prediction, while the MAE evaluates the mean error independent of sign, measured in ML/D. Generally, the accuracy of the forecast will depend upon the availability of historical records and the complexity of the UWD time series under study.
Results and Discussion
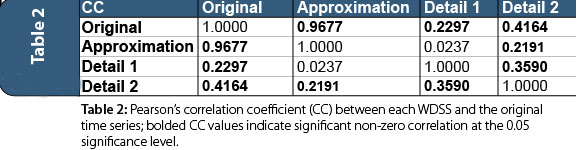
The results for step 2 of the MBELM development procedure (Figure 1) are presented in Figure 2, while steps 3 to 5 are shown in Figure 3. Table 2 provides Pearson’s correlation coefficient (CC) matrix examining significant correlation between each wavelet decomposed sub-series (WDSS) and the original time series at the 0.05 significance level.
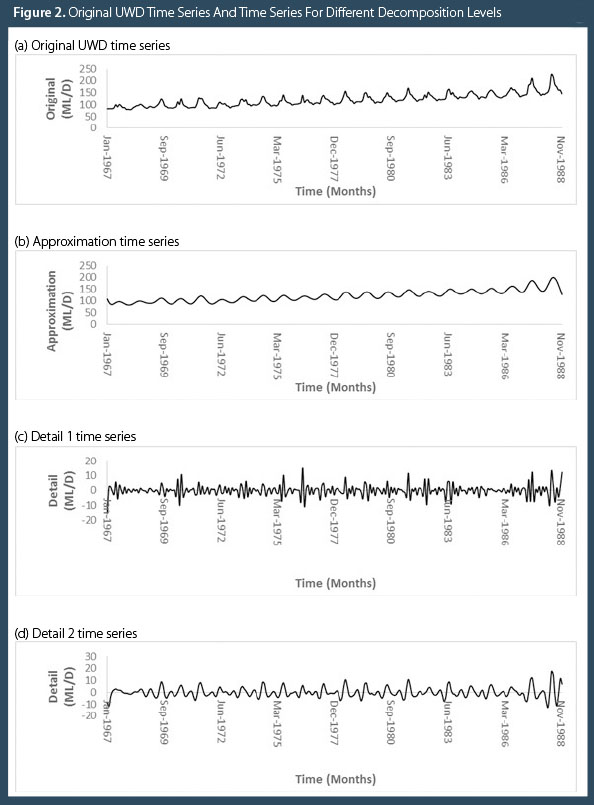
It is clear from Figure 2 that there are cyclical components embedded within the original time series. This highlights the usefulness of the DWT at extracting these important time series characteristics and exposing their periodic nature through time, which is not fully apparent in the original UWD record. Perhaps the most important characteristic revealed through the DWT decompositions for this time series is the extremely periodic nature of the approximation sub-series, which coincides with a 12-month periodicity superimposed on an upward trend. The two details series exhibit random, and at times sharp, changes from their regular periodic patterns.
Examining the CC matrix (Table 2), one can see that there is significant correlation between the original time series and each WDSS. Likewise, there are also cases of significant CC between WDSS members. This nuance supports the exploration of cross-scale dependencies in the urban water supply system to better understand how these scales interact and their influence on UWD variation through time (which is implicitly integrated into the MBELM approach presented in this article) supporting the findings of House-Peters & Chang (2011). Searching for dependencies between temporal scales is a worthwhile endeavor for a water manager because it can reveal system characteristics that may be exploitable for optimal pump scheduling, multi-objective reservoir operation, management and maintenance strategies, setting effective water-use rates, or determining when peak UWD events are likely to occur (among many other applications).
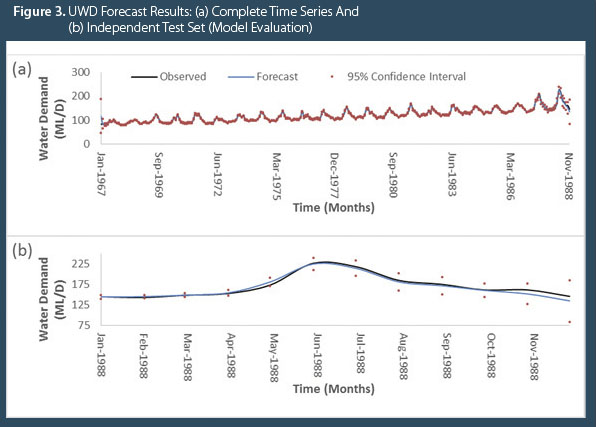
By deriving forecasts for each WDSS member using the ELM framework and aggregating their individual predictions, one is able to produce the “Forecast” presented in Figure 3: (a) for the complete time series record and (b) for the independent test-set evaluation. The uncertainty assessment through bootstrapping is then applied at the 95 percent confidence level and also presented in both (a) and (b) representing the complete MBELM framework.
For the independent test set, the COD for the MBELM is 0.9679, meaning that the MBELM forecasts explain more than 96 percent of the variance in one-month-ahead observed UWD. The MAE for the same period is 3.8821 ML/D. Both scores indicate the highly accurate nature of the MBELM forecasts. The confidence intervals also embody all observations within the independent test set, highlighting the reliability of using the MBELM for one-month-ahead revenue projections.
Conclusion
This article has introduced a new multiscale UWD forecasting tool with uncertainty assessment, namely the MBELM, and tested its abilities on monthly UWD time series for one-month-ahead revenue forecasting in London, Ontario. The case study revealed the MBELM can be applied to generate accurate and reliable one-month UWD forecasts that can be used by water utilities for revenue projections. It is important to note that the MBELM method presented in this article is amendable to different forecasting periods, such as hourly, weekly, quarterly, etc., extending its applicability to a host of other important water utility functions (some of which are mentioned in the Introduction and again in the Results and Discussion). Furthermore, the MBELM is not only accurate and reliable (through uncertainty assess ment) but also adapts to fluctuations in temporal scales embedded within the original UWD time series. Building on this last point, climate variables and economic indicators can be incorporated in the MBELM framework to study how UWD interacts with climate variability and economic momentum at different scales. This exciting factor allows water managers to incorporate climate and economic status into their water management decisions. The most enticing feature of the MBELM is its suitability to Big Data applications. Future Big Data research in the UWD forecasting domain should investigate the usefulness of the MBELM for operational forecasting of UWD time series extracted from Automated Metering Infrastructure (AMI) systems for automation and optimization of water utility system components.
About The Author

John Quilty (B.Eng., civil engineering with concentration in management, Carleton University) is an engineer with the City of Ottawa’s automated metering infrastructure project group and a researcher at McGill University, where he is pursuing his Ph.D. in bioresource engineering. John has contributed to water resources forecasting projects in Australia, Canada, Ethiopia, India, and Poland.
References
Adamowski, J., H. Fung Chan, S. O. Prasher, B. Ozga-Zielinski, and A. Sliusarieva (2012). Comparison of multiple linear and nonlinear regression, autoregressive integrated moving average, artificial neural network, and wavelet artificial neural network methods for urban water demand forecasting in Montreal, Canada, Water Resour. Res., 48, W01528, doi: 10.1029/2010WR009945.
City of London, 2013. Water By-law. [Online]
Available at: https://www.london.ca/residents/Water/water-bill/Pages/default.aspx
[Accessed 19 09 2014].
Courtney, M., 2014. How utilities are profiting from Big Data analytics. [Online]
Available at: http://eandt.theiet.org/magazine/2014/01/data-on-demand.cfm
[Accessed 03 09 2014].
Daubechies, I., 1990. The Wavelet Transform, Time-Frequency Localization and Signal Analysis. IEEE Transactions on Information Theory, 36(5), pp. 961-1005.
Donkor, E. A., Mazzuchi, T. A., Soyer, R. & Roberson, J. A., 2014. Urban Water Demand Forecasting: Review of Methods and Models. Journal of Water Resources Planning and Management, 140(2), pp. 146-159.
Efron, B. & Tibshirani, R. J., 1993. An Introduction to the Bootstrap. London, U.K.: Chapman and Hall.
Fullerton, T., Forthcoming. Analysis of the Effectiveness of Short-term Demand Forecasting and Recommendations for Improvement, Denver, CO: Water Research Foundation.
Hipel, K. W. & McLeod, A. I., 1994. Time Series Modelling of Water Resources and Environmental Systems. Amsterdam, The Netherlands: Elsevier.
House-Peters, L. A. & Chang, H., 2011. Urban water demand modeling: Review of concepts, methods,and organizing principles. Water Resources Research, 47(W05401), p. 10.1029/2010WR009624.
Huang, G.-B., Zhu, Q.-Y. & Siew, C.-K., 2006. Extreme learning machine: Theory and applications. Neurocomputing, 70(1-3), pp. 489-501.
Maier, H. R., Jain, A., Dandy, G. C. & Sudheer, K. P., 2010. Methods used for the development of neural networks for the prediction of water resource variables in river systems: Current status and future directions. Environmental Modelling and Software, 25(8), pp. 891-909.
Mallat, S. G., 1989. A Theory for Multiresolution Signal Decomposition: The Wavelet Representation. IEEE Transactions on Pattern Analysis and Machine Itelligence, 11(7), pp. 674-693.
Tiwari, M. K. & Adamowski, J., 2013. Urban water demand forecasting and uncertainty assessment using ensemble wavelet-bootstrap-neural network models. Water Resources Research, 49(doi:10.1002/wrcr.20517), pp. 6486-6507.
Zurada, J. M., 1992. Introduction to Artificial Neural Systems. St. Paul: West Publishing Company.