
Multiple Tests Of Large Axial Flow Pumps Under Varying Conditions Over Multiple Years
By Philip S. Stacy
Using field flow measurement techniques allows pump owners the ability to assess the performance of their equipment. One pump owner went to the next level by completing multiple tests of their equipment over multiple years and multiple conditions.
A U.S. power generating utility has recently been working with their state agency to better understand the volume of water used for their Circulating Water Cooling System. In addition, the use of an installed Circulating Water monitoring system was evaluated as a backup to system curves derived from pump speed for reporting Circulating Water (CW) flows.
In 2010, a confidential power generator contracted Alden to conduct a feasibility study of available equipment and/or techniques that could be used to monitor the intake flow at their facility (consisting of two operating Units). The feasibility study was conducted in response to the state environmental agency request, and the study was submitted to the utility in January 2010. Alden evaluated the available technological alternatives that might be used to monitor cooling water flows consistent with the direction provided by the state.
The Plan
As proposed in the feasibility study, a pilot study of pump speed versus system (flow) curves, verified with the use of an ad hoc metering device installed on one flow train, would be used to measure cooling water flow. Pump speed was controlled using variable frequency drives (VFD) and the flow versus VFD output, and differential pressure readings (from the in situ meter) provided a flow measuring technology with minimal disruption to the existing civil works. The CW flow versus speed and in situ differential pressure-based (DP) flow meter would be calibrated as a system using the dye dilution flow measuring method. Calibration was to be implemented during two outage cycles, providing a level of uncertainty of approximately 2 percent in the flow measurement.
In order to validate the proof of concept of the ad-hoc differential metering device, Alden conducted both physical and numeric modeling (Unit 1 physical model in 2012 and numeric modeling of Units 1 and 2 in 2014 and multiple field flow measurement tests of all pumps of Unit 1 in 2012 and 2015, and Unit 2 in 2013. In addition, repeated confirmatory flow measurement tests of the in situ meter were performed in November 2014, May 2016, and February 2018. These tested were conducted to validate the pilot DP metering device. Long term monitoring of the DP flow system began in November 2014 and concluded in May 2016 with additional data acquisition during the winter of 2017/2018. See Figure 1 for an overall project timeline.
Flow Measurement Testing Timeline
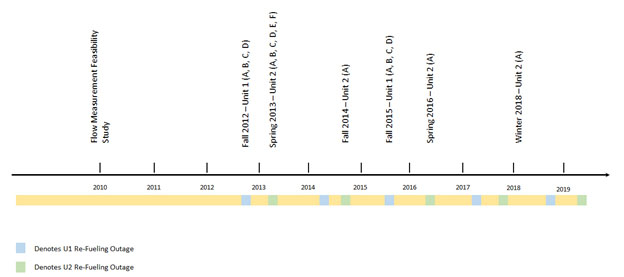
Figure 1 — Pump Testing Timeline
The Technique
The dye dilution method is based on a mass balance calculation. A small quantity of concentrated fluorescent dye is continuously injected at a measured, constant rate into the test flow. Concentration of the fully mixed flow is determined by fluorescence intensity measurements. The ratio of the injected concentration to the final concentration, minus any background concentration in the incoming flow, multiplied by the injection flow equals the fully mixed test flow.
The tracer used was Rhodamine WT, a fluorescent dye, which is detectable in very low concentrations using standard techniques. Calibrations were conducted with the stock solution and, as a result, the fluorometer concentration measurements are comparative measurements and the true stock solution concentration need not be known exactly to attain high measurement accuracy. The mixed concentration at the sampling location, of about 3 ppb, assured sufficient measurement accuracy while remaining undetectable by eye in the flow. Fluorescence is a function of water temperature, and must be considered in the measurement process.
During the flow measurement testing it important that no flow is withdrawn or introduced into the cooling water system between the dye injection and sample locations.
The Results
A considerable amount of pump performance data was obtained over the eight-year duration of the study as shown in Figure 1. In total, 161 individual tests were performed (see Table 1). This body of data confirmed the repeatable performance characteristic of flow versus pump speed. For example, Unit 1 Alpha pump was tested many times, at differing tidal (head) conditions, at multiple speeds, over several years. See Figure 2 for a graphical depiction of these results.
Table 1 — Pump Testing Summary
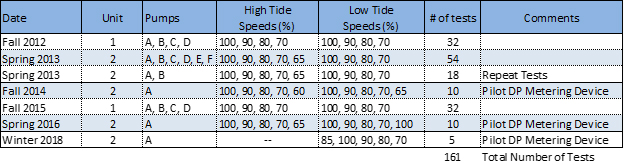
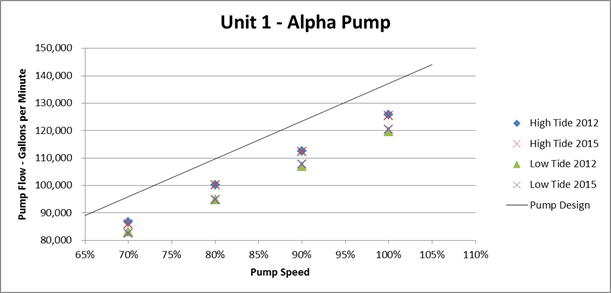
Figure 2 — Unit 1 Alpha Pump Testing Summary
The results of the Unit 1 Alpha pump testing indicate repeatability within 1 percent between 2012 and 2015. It also shows that the pump was producing less than the design flow by about 11 percent on average. The data collected on the other Unit 1 and Unit 2 pumps indicated similar performance. The results of the pilot in situ meter indicated that the meter was a viable option for long term flow monitoring, however; by confirming the relationship between pump speed and flow, using the dye method, reduced the need to rely on the pilot meter system.
A review of the highest flows measured for each pump (high tide at 100 percent speed) versus the design flow at 100 percent speed was completed to compare the average daily flows through both units. Since not all pumps were tested at the same time, the following conservative assumptions were used to determine total station flow:
- Since only the Unit 2 Alpha and Bravo pumps were tested multiple times, the flows for the remaining five Unit 2 pumps (measured in 2013) were added to each Unit 2 Alpha repeat test
- The higher recorded flow of the Unit 2 Bravo pump from 2013 tests was used for adding to each Unit 2 Alpha repeat test
- The average of the high tide (highest flow) and low tide (lowest flow) tests was used to determine daily flow
- The design flows for the service water pumps of Units 1 and 2 were used (conservative and small fraction of total station flow — less than 4 percent)
- The highest Unit 1 flows (from 2015) were added to all of the Unit 2 tests (2013, 2014, 2016, 2018) for total station flow
See Figure 3 for a depiction of total station flow. As shown, the largest measured pump flow was approximately 98 percent of the design flow. Based upon Alden’s performance testing experience at other facilities (28 circulating water pumps at 8 different generating units), pump flows are typically below design by as much as 27 percent. Since almost all of the testing conducted at this facility was at the end of re-fueling outages after condenser cleaning (i.e., when system losses should be at their lowest), the pump flows should have been at their highest. This conservatism combined with the uncertainty of flow measurement (about 2 percent) indicated that the facility has historically over-reported actual cooling water usage by as much as 139 million gallons per day.
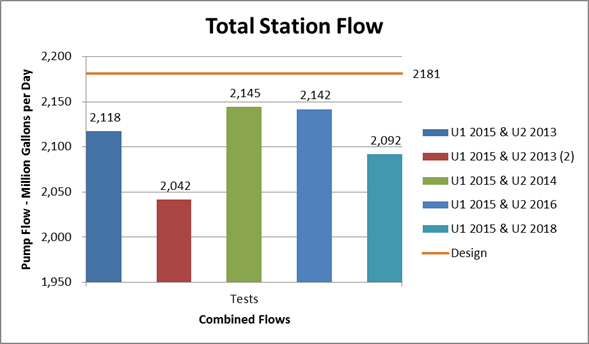
Figure 3 — Total Station Flows
Alden’s recommendation to the facility was to continue reporting total station flow as historically reported to the state agency because testing demonstrated that the plant flows are lower than reported. This conservatism eliminates the necessity of modifying the existing design VFD curves and/or installing flow meters on each cooling water train. Periodic flow testing to confirm that actual flows do not change may be required for the following reasons:
- Pump rebuild or replacement
- Pump degradation indicated by poor condenser performance (although this means even less flow)
- Modifications to the circulating water system that may influence the system curve (increased or decreased head loss)
- Environmental changes (i.e., increased biofouling, sea level rise, traveling water screen modifications)
The Takeaway
The most difficult piece of evaluating true performance of large pumps once they are installed is the measurement of the flow they produce. The testing described herein demonstrates that the dye dilution method provides consistent and repeatable results for measuring the flow of large pumps. The study also confirmed the practicality of an in situ flow meter that did not impact the operation of the plant. It is equally important to note that measuring these large flows often indicate that the pumps are not performing as assumed based on original design.
 Philip S. Stacy is the Director of Calibration Services at of Alden Research Laboratory. Mr. Stacy has conducted a variety of model studies, field flow and head measurement in his 30+ years at Alden. He is also the technical lead for field performance measurements of hydraulic turbines and large pumps, applying ASME code-accepted methods of flow measurement using current meters and the dye dilution.