
Model Behavior: Evaluating Instrumentation And Control In The Coagulation Process
By Selma Parreira Capanema, electrical engineer, Copasa
An electrical engineer does the math on coagulation process control, using computational modeling to determine best practices.
Developed from a water treatment plant (WTP) in Brazil, a new study aimed to evaluate the use of analytical instrumentation in coagulation process control and to develop models that, once associated with control technique, could be applied to carry out the coagulant dosage automatic control.
Once the more suitable instruments for this WTP’s water quality were defined, a database was built. Applying nonparametric methods through cross correlation, it was possible to evaluate the relationship among the process variables and identify the most relevant variables for the development of the models. Once the variables were defined, a variety of models were developed using an artificial neural network (ANN) and a neuro-fuzzy network (NFN) of distinct topology. The goal was to come up with a representative model of the operator’s behavior when controlling the coagulant dosage, and a model to predict the settled water turbidity. These models were implemented in a program in C++ language. The program was connected to a SCADA system by applying the plant’s automation resources, which are what made it possible to acquire the values of the input variables and to record the output of each model online.
Analytical Instrumentation For Water Features Measurement
The analytical instruments supply data in real time for a great variety of needs in WTPs. Before any modeling technique or process control system could be implemented, we first had to identify the instruments we needed to assess its response, choose the measurement technique best suited to installation conditions, define the needs for processing the output signal, and decide on data validation rules.
Considering the errors from the measurement system, we determined that using the raw data without any kind of processing could damage the efficiency and the reliability of the model and the control system.
Methodology Used For The Development Of The Work
The development of systems that could identify the operator’s behavior and predict the turbidity of the settled water involved creating models from a database collected throughout one year. For the construction of these models we used a technique of parametric modeling based on fuzzy logic and an artificial neural networks approach.
In the WTP studied, the operator performs the analysis of turbidity of the settled water to evaluate the efficiency of dosage adjustment. The operator’s behavior while controlling the coagulation system is similar to an open-loop control because the control action is defined only by the input parameters of the system. In this case this behavior could be represented as shown in Figure 1:
Figure 1: Identification of the operator’s behavior
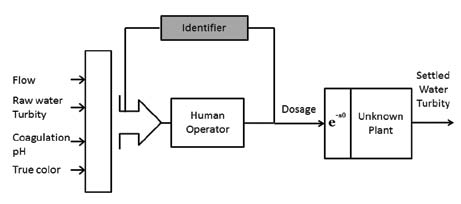
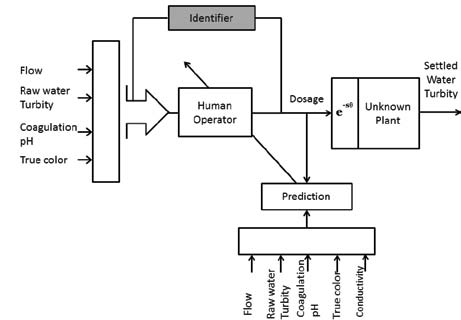
In order to close the loop, it is necessary to obtain a prediction of the system output because there is a dead time between the control action and the effective reaction of the system.
Figure 2: Prediction of settled water turbidity
The alternatives for the identification of the systems involved in the coagulation process (coagulant dosage control based on operator’s knowledge and prediction of the settled water turbidity from the entries of the plant) are the construction of linear or nonlinear models.
Adopting a linear modeling technique would demand a multivariable and high complexity model. In addition, the representation of these systems from the impulse response is not possible due to the natural coupling of input variables and also due to the fact that these impulses interfere in the operation of the water treatment station that cannot have its productive process disturbed or interrupted.
Therefore, we opted for an identification approach based on the techniques of artificial intelligence. In this way we create a tool to aid the operator. As the operator changes the dosage, information of the estimated turbidity of settled water is obtained, which will allow the operator to perform interventions in the process in order to improve the quality of the settled water. Once the behavior of the operator controlling the coagulant dosage is identified, it is possible to provide references for dosage adjustment for the different conditions of the process. Such models can also be used in a strategy to perform the automatic control of the coagulant dosage.
Correlation Of Variables For Determining The Parameters
Analyzing the correlations of the variables of the coagulation process, one can identify in an appropriate way which of them may compose the inputs of the neural networks that will identify the operator’s behavior and predict the turbidity of the settled water.
Table 1: History of attempts to obtain the model for prediction of the settled water turbidity
| IMPLEMENTED MODEL | STRUCTURE | INPUTS |
| Preliminary model based on a MLP (multilayer perceptron). | 1 ANN with 10 inputs, 15 nodes in the hidden layer. | Turbidity of the raw water, conductivity, flow, pH, dosage, and their respective values 30 min before and the type of coagulant used. |
| Remodeling of the previous attempt. | 1 ANN with 10 inputs, 25 nodes in the hidden layer. | |
| Set of models with simple selector. | 2 ANN with 10 inputs, 25 nodes in the hidden layer using the turbidity of the raw water as parameter of model selection. | |
| Set of models with selector based on LVQ algorithm. | 2 ANN with 5 inputs, 25 nodes in the hidden layer using the LVQ algorithm with the raw water turbidity and the true color as parameters for the model selection. | |
| Neuro-fuzzy structure with online training | Yamakawa Network considering 2 membership functions. |
Turbidity of the raw water, conductivity, flow, pH, dosage, settled water turbidity, and their respective values 1.5 h before. |
We used the MATLAB routine called crosscorr.m to generate graphs of cross-correlation. Using the graphs of cross-correlation, we made an analysis to check whether there is a relationship between the variables, the direct or inverse way that they relate, and the dead time of the process.
Modeling
Prediction Of The Settled Water Turbidity
Several models were developed performing variations in parameters and in the topology of the ANN. See Table 1.
Identification Of The Operator’s Behavior
In order to model the system to identify the operator’s behavior, when performing the coagulant dosage control activity, we used the same database used for predicting the settled water turbidity and cross-correlation of the graphics obtained.
The prediction of the settled water turbidity was not initially inserted as neuro-fuzzy model input because the operator does not currently use this information to control the dosage. The prediction will be inserted as information for the operator to improve the performance of the coagulation process and consequently generate a new database useful in remodeling the identification of the operator’s behavior system. The prediction is also a feature of great value when there is a failure in any instrument, working as an estimator of the settled water turbidity.
ANFIS network was used to model the operator’s behavior. Gaussian membership functions were used to perform the training. The type of equation used in defuzzification was a linear equation in the parameters ΣPij. Three membership functions were used.
Presentation Of Results
In order to obtain results in the field, automation resources available in the WTP were used. The existing SCADA allows access to the database through programs developed in C++. This SCADA’s feature allowed the programs developed for implementing the models to perform the reading and writing in tags configured for the model’s input and output variables.
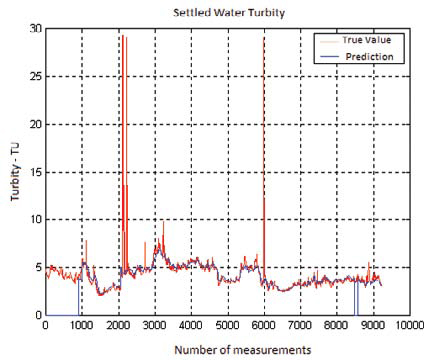
Figure 3: Settled Water Turbidity
Prediction Of The Settled Water Turbidity
Figure 3 on page 25 shows the signs of turbidity and prediction in different real-time base, i.e., to each measurement the real current turbidity value is shown in the red curve and in accordance to the modeling; the blue curve shows the turbidity for the next 1.5 hours.
Identification Of The Operator’s Behavior
The program developed to identify the operator’s behavior uses resources already developed for the program in predicting settled water turbidity.
The amendment made was basically in the class that implements the model being tested, in which we used the following matrices obtained from training for the calculation of the output, i.e., the value of dosage:
Matrix P — matrix 3 x (4 +1) that represents the linear models;
Array S — matrix 3 x 4 with the standard deviations for the Gaussian for each entry;
Matrix Xm — matrix 3 x 4 with the average values for the Gaussian for each entry.
This program reads the configuration file of the following data:
- Tags of input variables — turbidity, color, flow, pH;
- Tags of program output — color and dosage generated by the model;
- Neuro-fuzzy model — averages and standard deviations of the membership functions, in addition to the linear models used for defuzzification, expressed by the matrix mentioned above.
Figure 4: Identification of the operator’s behavior

When the program is connected to the SCADA, it performs the following functions:
- Reads variables that were collected manually, which are color and type of coagulant;
- Reads and stores the input variables to each second, understanding that before storing the variable it undergoes a process of filtering;
- Computes the dosage based on current parameters and model neuro-fuzzy;
- Writes the dosage calculated and the color in the SCADA;
- Shows onscreen all current process variables and makes a comparison of the program between the dosage of the model and the actual dosage performed by the operator.
The results obtained in the field are presented in Figure 4. The graph shows the daily record history for the dosage values effectively practiced by the operator and those calculated by the model.
Although we tried to use different topologies of ANN, the results of the field were not satisfactorily observing that variations in input variables had little significant weight in output variable. The model output was primarily influenced by its own delayed output. These facts raise several hypotheses, such as:
- We may not have considered all the variables of entry necessary for the proper representation of the process.
- The operator’s action may have been the cause of low correlations obtained, making it difficult to obtain a representative model of the dynamics of the plant, based on the data collected.
For future work we suggest the construction of a new database considering the system in open-loop control and segregating the operator action from the dynamics of the process.
The modeling of the operator’s behavior presented results considered satisfactory. This implemented model already has practical application and may be used to replace most of manual interventions. However, because it is a model in openloop control, it still requires a feedback signal, in this case represented by the prediction of the settled water turbidity.
 Selma Parreira Capanema is an electrical engineer who develops studies in the field of computational intelligence with application to real-world problems in water supply systems. She currently works for Copasa, located in Brazil.