
Membrane Treatment Of Groundwater
The groundwater that a southern Louisiana water utility supplies to local residents has traditionally carried a high amount of organic material and color. In the past, the organics were oxidized and broken down by chlorination, but this practice had gone out of favor due to production of disinfection by-products (DBPs) such as Trihalomethanes (THMs) and Haloacidic Acids (HAAs). The utility has therefore sought to remove the need for chlorination from the injection point near the initial storage tank and treat the raw water completely via cartridge pre-filters followed by a bank of membranes in the treatment plant. A process flow diagram of the plant is shown in Figure 1:
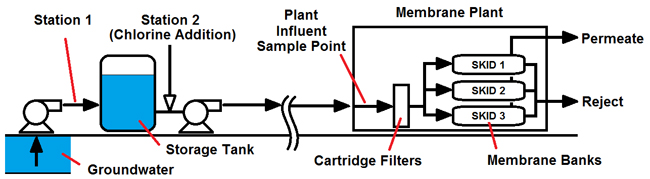
Figure 1: Groundwater Treatment PFD
While the plant performed well in the past when most of the organics had been removed via chlorination, significant problems developed once pre-chlorination was shut off. The pre-filters and membranes became severely fouled with a thick film and had considerable odor. To troubleshoot this problem, the utility enlisted the services of Thornton, Musso, & Bellemin, a local water and wastewater service company. TMB uses LuminUltra’s 2nd Generation ATP monitoring technology as their primary tool for rapid assessment of microbiological content in municipal water systems and aimed to use it in this situation to characterize the nature of the treatment problems. If the issue was found to be biological, ATP tests would be used to help monitor the efficacy of both disinfection and membrane treatment throughout this optimization study.
Results
The pre-chlorination rate was set to a reduced rate compared to the previous dosage during the mid-summer months in hopes of establishing a middle ground where DBP formation was reduced while still cutting down the organics loading and color in the raw water. After several days, the following results were seen compared to before the change in chlorine dosing:
Table 1: Effects of Pre-Chlorination on Microbial Loading (< 10pg/mL = Acceptable, > 10pg/mL = Contaminated)
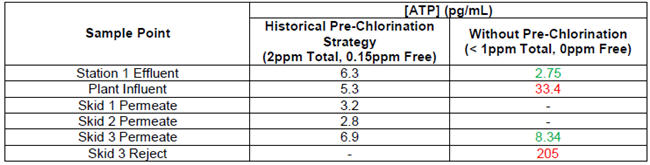
While the reduced chlorination prior to membrane filtration reduced the organics loading and DBP production, the microbial loading at the plant inlet became significantly higher. The treated water quality also suffered, as was seen from the Skid 3 Permeate test, but plant personnel decided to allow the experiment to continue for the time being since the increased microbial content of the permeate was determined to be not significant.
After an additional week under these conditions, though, the treatment plant was shut down due to excessively high pressure differentials across the membranes. The ATP results at the time of shut-down were as follows:
Table 2: Effects of Long-term Removal of Pre-Chlorination
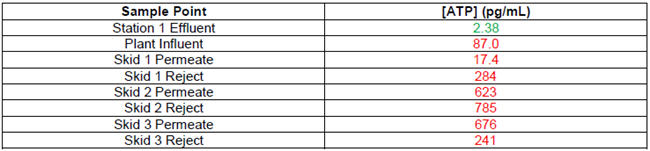
The effects of reduced pre-chlorination are clearly seen here by the significant increase in microbial loading to the plant between the Station 1 Effluent and the Plant Influent. At the time of this measurement, the raw water carried no chlorine residual (neither free nor total) so there were no barriers to the proliferation that occurred in the pipeline. This increased loading resulted in significant fouling of the pre-filters and eventual microbial breakthrough and significant membrane fouling. Membrane fouling was confirmed by testing the surfaces of the end cap of a membrane in addition to a deposit that was removed from the membrane surface:
Table 3: Results of Membrane Biofilm Analyses

These values for surface buildup were 10-100 times higher than what would be considered tolerable, although they were not surprising considering the magnitude of the bioburden in the water feeding the membranes. Upon seeing this, a series of membrane cleanings took place to remove the fouling that had developed. Table 3 illustrates the efficacy of this cleaning:
Table 4: Effects of Membrane Cleaning
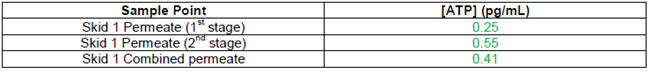
According to these results, it is clear that the cleaning cycle did an excellent job to clean the fouled membranes. The product water quality is now in the acceptable range (< 10pg/mL) and therefore carries a lower risk for microbial proliferation downstream assuming that an acceptable disinfectant residual is maintained. It was now clear that a certain degree of disinfection was necessary to minimize fouling of the pre-filters and membranes in the plant, so after the cleaning process, the following changes were instituted to the operating procedure:
- Chlorine was discontinued prior to the storage tanks.
- Chlorine and Ammonia (Chloramine) was instead fed to the water as it left Station 1 to inhibit microbiological growth in the transmission line from Station 1 to the Plant Influent.
- De-chlorination was moved from before the prefilters to behind them.
After three weeks of running under these new conditions, another set of samples collected and analyzed with the results shown in Table 5:
Table 5: Baseline Data Following New Operating Conditions
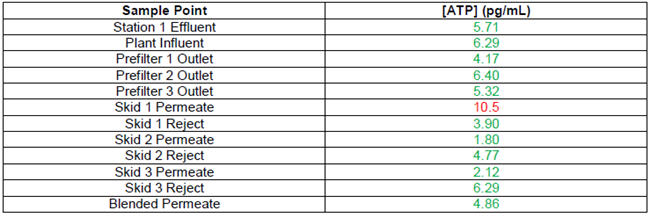
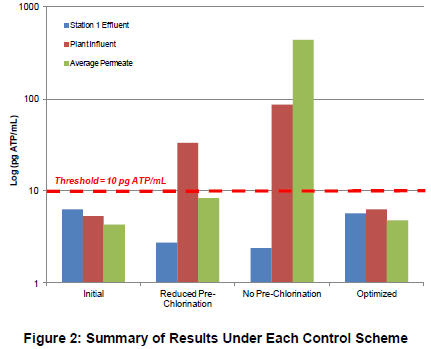
While the overall cleanliness of the product water has risen slightly, the overall picture is significantly better than when the membranes had become fouled earlier in the summer. The plant’s strategy was then to perform semi-routine tests on the water downstream of the pre-filters as well as the combined membrane product water to detect deviations from baseline conditions to take a more pro-active stance. The following graph shows a summary of results from the beginning compared to the optimized conditions (expressed as Log(pg ATP/mL)):
Conclusions
The results of ATP monitoring throughout this process was able to quickly identify elevated microbial content not only in the raw and treated water, but also within the membranes themselves. This enabled personnel to assess the effects of decreased pre-chlorination, diagnose the fouling issue as a biological problem, and assess the efficacy of the membrane cleaning process – all within minutes of sample collection. The utility will continue to employ ATP monitoring on a semi-routine basis to ensure that their purification process continues to be effective while staying within environmental compliance targets for DBPs.