
How To Evaluate Predictive Models For Lead Service Line Inventory And Replacement
By Jared Webb and Dunrie Greiling

Get an accurate service line material prediction for Lead and Copper Rule (LCR) compliance by avoiding modeling pitfalls.
The U.S. EPA has included predictive modeling as a service line material investigation method. The approach sounds straightforward: Use the information you know to make predictions about what you don’t yet know. Utilities can then use those predictions to prioritize lines for excavation and replacement.
If you are not a trained data scientist, how do you pick an approach? This article will cover what predictive modeling is and give you questions to ask to help you choose wisely.
What Is Predictive Modeling For Lead Service Lines?
Utilities do not have complete or even accurate service line materials records. In the absence of comprehensive records, utilities have turned to data science to predict unknown service line materials. They can then use those predictions to prioritize lines for excavation and replacement.
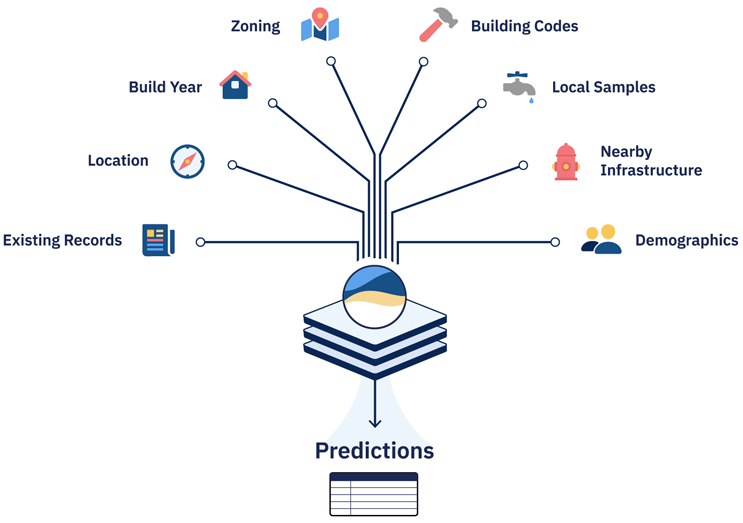
A predictive model uses known information to predict what is unknown: service line materials, in this case.
A model can use many inputs, including the utility’s historical records and information about the local built environment such as build year, zoning, location, demographics, information on nearby infrastructure like fire hydrants, and local water samples.
The process is iterative: Where lead is and is not found guides the model to make better predictions.
Question The Data
How Do Models Handle Biased Data?
Biases can emerge when certain types of homes or neighborhoods occur too often or not at all in the records used for prediction. For example, if most historical records are for a particular neighborhood within the city, the model will likely perform well in that neighborhood, but be less accurate for other city neighborhoods.
These biases can come from:
- ease of access
- inspecting only where you expect to find lead
- recent work in the area
- residents’ participation.
We have seen that historically disadvantaged communities tend to be in older, more urban areas where construction and reconstruction records are scant compared to newer, more suburban areas.
With statistical prediction, it’s “garbage in, garbage out.” In short, a model that has been trained on biased data will provide inaccurate, biased results. While sophisticated techniques to debias data exist, the best and most straightforward approach is to collect representative data (e.g., data from across the city chosen randomly rather than by convenience) to feed the model.
If your modeling approach does not include obtaining or ensuring representative data, that’s a red flag.
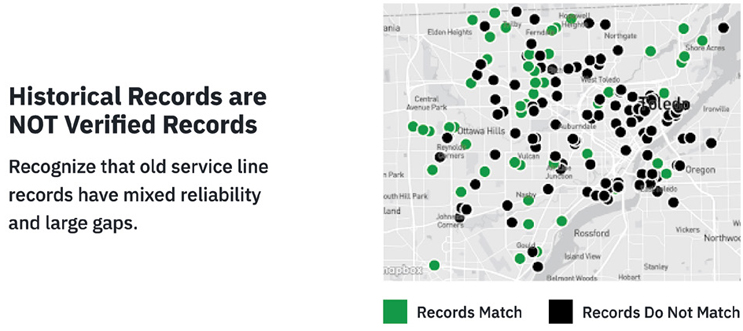
Does The Model Accept Historical Records As Truth?
Unfortunately, the paper records that utilities have often do not reflect the reality of what’s in the ground. Although tap cards and other records may have been accurate when they were created, they have not been consistently updated after the fact.
Inspections show that many of our utilities’ historical records are inaccurate. (The record does not match the material in the ground or home.)
If the model or modeling team trusts these records without verifying their reliability, the model will make inaccurate predictions from these records.
Ask how the predictive model will treat historical records. Be wary if they are accepted uncritically as truth.
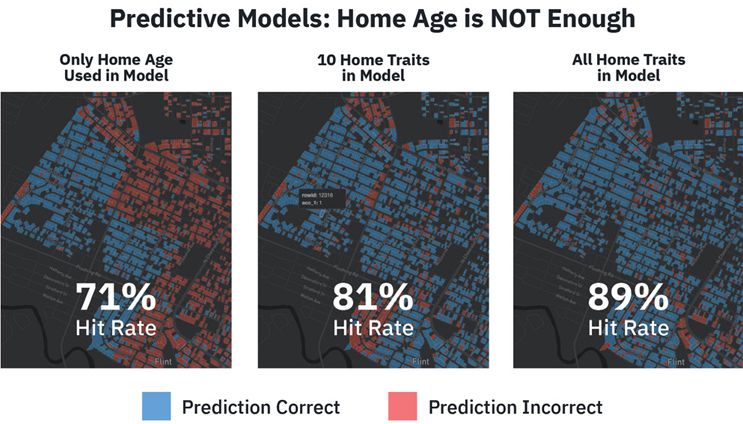
What Data Does The Model Use Beyond Historical Records?
Some water utilities and engineering consultants make predictions about service line materials using only home age or home age and building codes. However, home age and other inputs — including verified service line material records; zoning; building codes; location and timing of infrastructure updates (e.g., water main and hydrant replacements); and census data about demographics — predict more accurately than home age alone. While no single feature is necessarily predictive, it’s important to see who is living in affected areas so that utilities can incorporate environmental justice into their planning, funding, and communications.
Ask whether the model uses information beyond the historical records brought by the utility. If not, red flag.
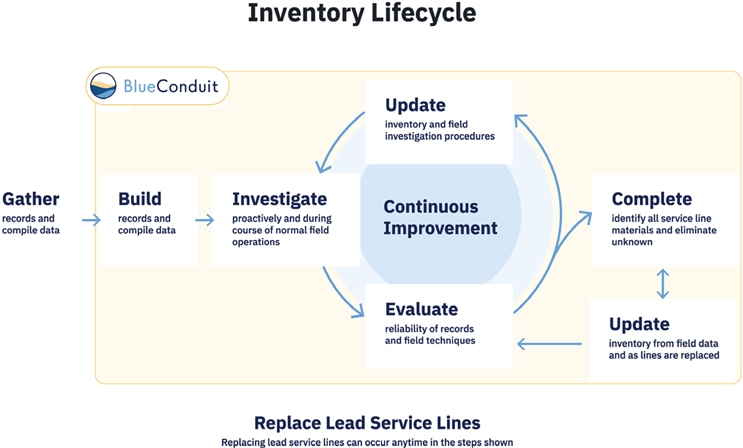
How Does The Modeling Process Incorporate New Information?
A statistical model that is run once but is trained on representative data will work well. A model that is updated with new information will show continuous improvement.
As new data from inspections and replacements are gathered, the model will adapt to that data and make more informed predictions to locate lead service lines in the area.
Beware the “one and done” approach. Ask how often the model outputs will update.
How Do You Define Success?
We have heard results described this way: “We dug only where the model predicted a high probability of lead and had a great hit rate.” That is...frustrating. We want to get all of the lead out of the ground, not just the “high probability” lead.
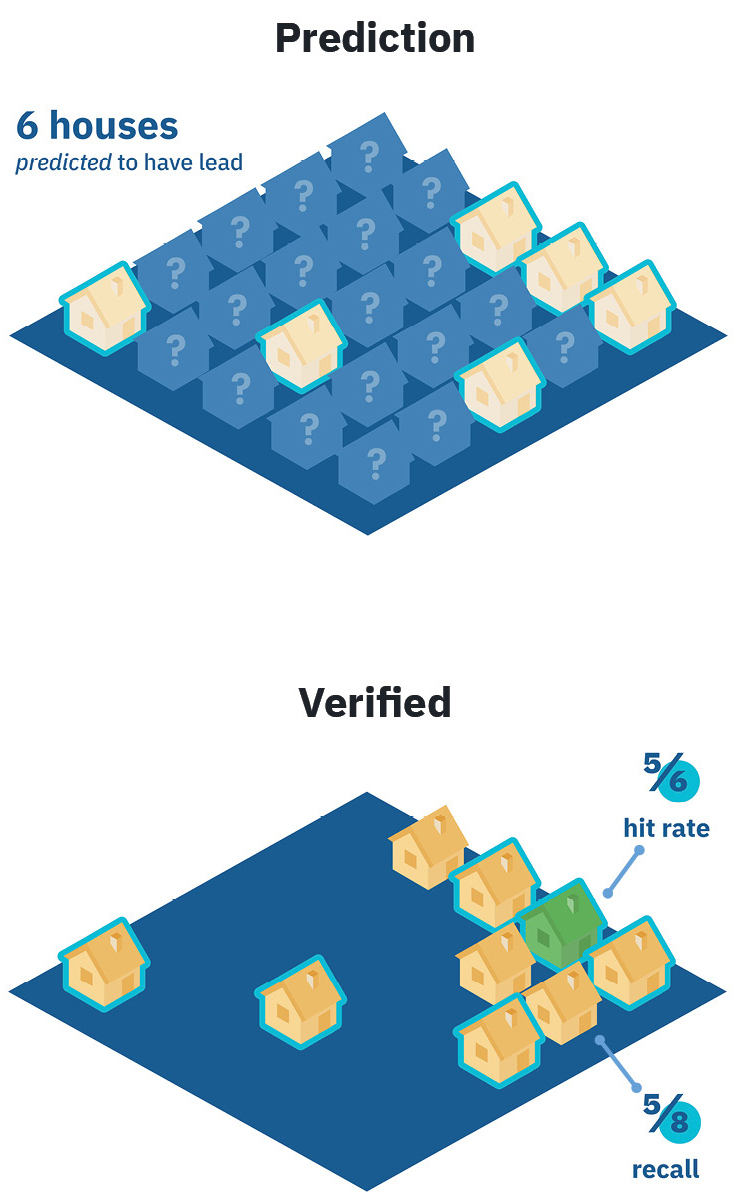
One way to measure a predictive model is by its precision or hit rate. Is there lead where it predicts lead?
Reminder: A model’s hit rate is just one of many indicators of success.
Another way to measure a model is recall. Recall measures how much lead a predictive model is able to locate out of all the lead in the ground.
It’s a trade-off — models with better recall may have poorer hit rates. The full recall of a model is only calculable once every service line has been inspected. However, with a representative sample of service line materials, a model’s recall can be estimated with high confidence.
Be wary of sky-high hit rates without other success metrics or context. Ask about recall as well as hit rate.
Compared To What?
An easy way to make a model look smart is to compare it against something less so. A red flag is when the comparison for the model is random guessing. “Our model did better than a computer picking random addresses to test for lead.”
It is doubtful any utility would replace service lines via random guessing. They would use something more intelligent than that, such as “Go in order from oldest to newest home within this time range” or another approach informed by their experience.
Ask what success is evaluated against, and be wary if it is compared to a strategy that you wouldn’t use yourself.
See blueconduit.com/resources/ for more about our model, its predictions, and outcomes.
About The Authors
 Jared Webb is BlueConduit’s chief data scientist. His responsibilities include processing and analyzing customers’ data, managing relationships with technical service partners, and producing output of machine learning results. He has been a member of Dr. Schwartz’s and Dr. Abernethy’s team since 2016 and has served as chief data scientist since the formation of BlueConduit. Jared received his undergraduate and masters in applied mathematics from Brigham Young University, where he focused on the mathematical foundations of machine learning models.
 Dunrie Greiling is BlueConduit’s chief product officer. She combines her training in science (biology PhD, University of Michigan) with her two decades of experience in tech startups. Prior to joining BlueConduit, she worked in science-based software and device companies in many roles — as an employee, as a consultant, and as an advisor and entrepreneur-in-residence.