
Estimating Sewer Costs: A Mathematical Model
Contents
Abstract
Introduction
Site-Specific Cost Elements
Gravity Sewer Cost Estimating
Low-Pressure Sewer System Cost Estimating
Application of the Model
Example
Results
Abstract
An easily applied spreadsheet model for estimating construction costs of sanitary sewers has been developed; the model is useful in comparing design approaches, including gravity and pressure alternatives. No technique produces estimates that anticipate the myriad unplanned events and unanticipated field factors that every real-world job entails. Even so, a good estimate is a necessity to all involved in designing, planning, financing and constructing a sanitary sewer system. This method has been of considerable value in the authors' company and it is hoped that consulting engineers and planners also will find it useful.
Construction cost data taken from "Means Site Work and Landscape Cost Data," published annually by R.S. Means Company and other reliable sources are built into the model. The user chooses from an array of options describing choices and site conditions. The model estimates a national average cost per house for the collection system under consideration. All estimates are calculated on a per-mile-of-sewer basis.
Correction factors can be applied for differences in construction cost for specific cities. These indices are available for 28 New England cities, including Bridgeport, Hartford and New Haven, CT; Augusta and Portland, ME; Boston, Hyannis, Lowell, Pittsfield, Springfield and Worchester, MA; Manchester, New Hampshire; Providence, RI; and Rutland, VT.
A specific example will be highlighted, showing input assumptions and the resulting cost estimates. By exploring ranges of assumed conditions, it becomes obvious which factors most significantly affect cost. For example, trench depth and lot width have a much greater influence on construction cost than manhole spacing.
By providing a rational and systematic preliminary cost estimate, this technique takes much of the uncertainty out of quickly choosing among the alternatives and arriving at a sound, site-specific, collection system design recommendation.
Introduction
Some advantages of pressure sewers are less environmental trauma during construction, reduced volume of flow and freedom from infiltration/inflow, and O&M costs can be lowered (Farrell 1992). However, capital cost is still a paramount factor in choosing the best design and obtaining funding.
This spreadsheet-based model provides the consulting engineer with a tool for making a comparison of construction costs for gravity and pressure collection system alternatives for a specific parcel of land of existing residential area.
The mathematical model uses the key elements of cost for both gravity and low-pressure sewer (LPS) systems to construct an estimate of overall cost for each alternative.
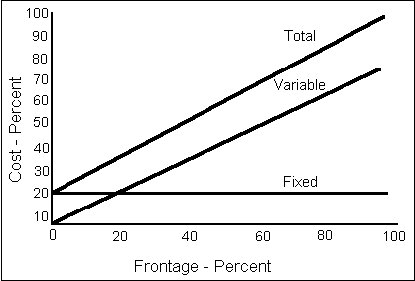
Discussed herein are the most significant cost factors for each type of sewer system, the basis for the model's data and some preliminary results. In the simplest terms, a wastewater collection system includes both fixed and variable costs. The gravity and LPS systems each will have a different fixed cost per home and different variable cost per home.
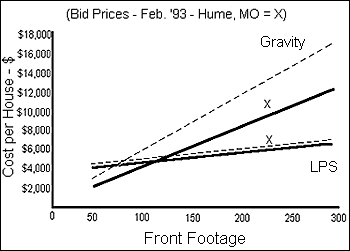
For example, Figure 1 (below) shows a curve of sewer cost plotted to show the cost per home dependent upon the spacing between homes, i.e. lot size. Figure 2 shows two representative lines: one for LPS and one for gravity sewers. The lines intersect at a "break even" point. This point represents the lot width at which both system costs should be equal, given the underlying assumptions about topography and soil conditions.
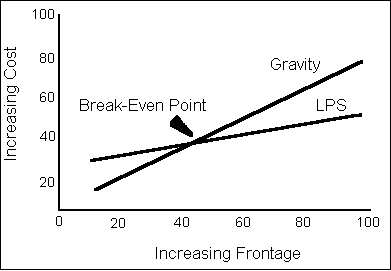
The original focus of this work was to generate these comparison curves for different scenarios such as "flat with high ground water" or "hilly with rocky soil." It was quickly determined that a more flexible tool would be valuable. Such a tool would permit any number of conditions to be considered in various combinations to allow a more comprehensive, site-specific, comparison to be made.
Data was collected to establish the fixed and variable cost under varying conditions for both types of systems, LPS and gravity. A baseline for each type of system was created assuming a typical system design. Correction factors for site-specific criteria were then created to further refine the estimates.
Site-Specific Cost Elements
The most significant site-specific factors impacting sewer system construction cost are:
- Topography (flat, rolling hills, steep)
- Soil Conditions (rocky, high water table, tractable)
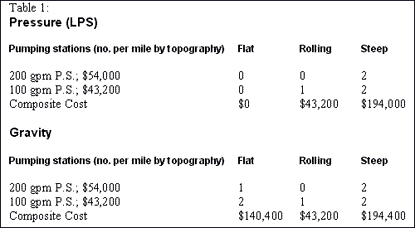
In addition to actual bid price history from "Site Work and Landscape Cost Data" (Means 1996), adjustments, or multipliers, based on experience and judgment are proposed for possible variations within these characteristics. Topography will influence the number of lift stations required in a gravity system, and, in some instances, can necessitate the inclusion of lift stations in an LPS system. As can be seen in Table 1, it has been assumed that the natural contours present in rolling terrain can be taken advantage of to minimize the use of lift stations when compared to flat or steep terrain.
Topography also will dictate the burial depth of the gravity lines. Table 2, below, shows the estimated percentage of pipe at various depths for different topography. For simplicity, costs were derived for three different trenching depths: 6 feet, 12 feet and 18 feet. It is believed that this is a realistic range since most collection systems will start at 3 to 4 feet (deeper if serving basements) and descend to about 18 to 24 feet before requiring a pumping station.
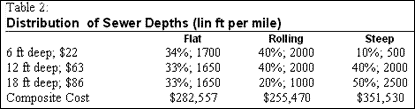
In flat terrain, the assumption is made that an equal amount of pipe will be buried at the three depths indicated since the pipe will be laid in a "saw-tooth" pattern from pump station to pump station. Alternately, in rolling terrain, the engineer will be able to take advantage of the natural descent of the terrain to provide the proper slope of the piping system. Therefore, it has been assumed that less pipe would need to be buried at the greater depths. This is reflected in Table 2. Finally, in steep terrain, the authors believe a higher percentage of the piping network will require installation at the greater depths. This assumption reflects the need to transport the flow over a series of summits and valleys without excessive pumping.
Topography will have very little bearing on LPS pipe burial depth. The low-pressure sewer system pipe depth is driven almost exclusively by the frost penetration in a particular region. In warm climates, the pipe may be buried just deep enough to provide protection against mechanical damage. (In the Scandinavian countries, LPS piping is routinely installed above the frost line in insulated, heat-traced, sand-filled, foam boxes.)
Soil conditions obviously will impact construction costs. The baseline construction costs used in the model assume tractable soil. Trenching costs assumed a 1:1 slope and no sheeting. (Estimates for trenching with sheeting at 12-foot and 18-foot depths were three to four times greater.) Trenching costs assumed bank-run sand bedding 12 inches over the crown of pipe and include backfill and compaction. Correction factors, or adjustments, were then developed to allow for construction costs in rocky conditions and high ground water. These are the most predominant situations impacting installation cost and are frequently among the drivers leading to specification of low-pressure sewers.
Gravity Sewer Cost Estimating
A gravity sewer is constructed using pipe laid on an ever-descending slope until depths typically reach 18 ft to 24 ft. At that point, a pumping station will be used to lift the wastewater up to near grade to begin the next descending run. Pumping stations can be a considerable factor in the total cost of gravity sewers. The best economic conditions for gravity tend to exist in tractable soil with gentle contours following natural waterways. This allows many more stretches of pipe to be laid along the downhill contour of the land and thereby reduces the depths of excavation as well as the number of pump stations. Because of the solids content in unground wastewater, gravity lines must be sized large enough to prevent plugging or restriction by unground gross solids. The model assumes a typical pipe in a gravity sewer to be 8-inch PVC.
Other areas of concern include spacing and depth of manholes and the spacing and capacity requirements for pumping stations. The model assumes manhole spacing of 600 feet with the number of manholes at each depth corresponding to the percentage of pipe at each of the three burial depths. This results in a composite manhole cost-per-mile of sewer built into each of the different topography estimates. As discussed earlier, pumping stations needed per mile are assumed for each of the terrain types, as shown in Table 1.
Low-Pressure Sewer System Cost Estimating
In a low-pressure sewer system, all residential wastewater is ground into a fine slurry and pumped through small-diameter pipes to treatment by a grinder pump located at each home. Because the wastewater has been ground into a slurry and is under pressure, the small-diameter pipelines can be placed in narrow, relatively shallow trenches following the contour of the land whether uphill, downhill or over extended sections of flat terrain. The model assumes a frost depth of 4 feet and corresponding burial depth. The most significant element of cost in a low-pressure sewer system is the cost of the grinder pumps at each dwelling unit. Other costs include the small-diameter piping and its installation.
The model assumes a combination of 2-inch, 3-inch and 4-inch SDR-26 PVC pipe. (SDR-26 is used in this example because it is priced in means. However, the Environment One Design Handbook [Environment One Corporation 1995] recommends SDR-21 as the preferred choice.) The distribution of sizes has been assumed to vary slightly, dependent upon topography. Cleanouts, air relief valves and terminal and junction valves also are included in the low-pressure sewer system cost model as appropriate. On occasion, pump stations may be needed, depending upon the size of the system, topographical conditions and the type of pump used. The model is based on the use of SPD-type pumps. Centrifugal grinder pumps will generally require additional lift stations. The number of lift stations assumed in the model for each topography is show in Table 1.
Application of the Model
The model is applied to a potential project by working first from the proper topographical subgroup, i.e. flat, rolling or steep terrain. This will generate cost estimates per mile of sewer for LPS and gravity, based on the following assumptions:
For all sewers:
- Houses on both sides of the street
- 95% of street frontage used
- Sewer main per house = 1/2 the lot width
- Collection system only; no treatment included
- Costs based on national averages from Means' "Site Work & Landscape Cost Data," 16th Ed.
For Gravity:
- Manhole spacing of 600 feet
For LPS:
- One grinder pump per house
- Grinder pumps are 60-gallon, SPD-type installed in yard
- Three terminal and four inline cleanouts per mile
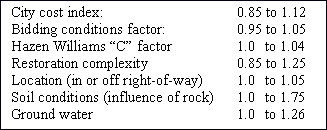
From this point, a number of adjustments based on judgment and experience can be made to further refine the estimates. These factors include:
Once the appropriate adjustments have been applied to reflect actual circumstances, a cost- per-mile of sewer is established. This number then can be converted to a cost per home for various lot sizes to determine the most cost-effective solution.
Example
The following site-specific conditions exist in our example (personal communication 1993) project:
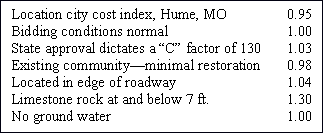
Applying these adjustments to the basic National Average Cost of the gravity sewer per house, yields the following adjusted cost estimate:
Adjusted Cost:
$9,419 x 0.95 x 1.00 x 1.03 x 0.98 x 1.04 x 1.30 x 1.00 = $11,731
The basic and adjusted calculations for Hume, MO, are plotted on Figure 3, and actual bid prices from February 1993 by the winning contractor are overlaid as "X"s. The correspondence is within 10%, definitely accurate enough to make a correct decision based on the results.
Discussion of Results
Clearly, the site-specific conditions play an important role in providing meaningful economic data for comparison of sewer system alternatives. While the spreadsheet model has already provided useful data for comparison, additional refinement is ongoing. By studying existing systems, the authors hope to further validate some of the assumptions embedded in the model such as those regarding percentages of pipe at different depths for the various topographical conditions. Future generations of the model can allow for greater user selection of input data such as pipe sizes, manhole spacing, pump station requirements and use of trenchless technology. This flexible structure for the mathematical model will facilitate the rapid analysis of many different permutations.
Conclusions
- The heart of the technique is based on use of nationally-comprehensive cost elements, as collected and published annually by R.S. Means.
- The model encourages and facilitates inclusion of a comprehensive list of cost factors.
- Application of the model has shown that in many instances, low-pressure sewer systems offer a significant economic advantage in reduced capital costs versus gravity sewers.
References
- Farrell, R. Paul, "Two Decades of Experience with Pressure Sewer Systems," Journal of the New England Water Pollution Control Association; 26-1. May 1992.
- R.S. Means Co., Inc., "Site Work and Landscape Cost Data," 16th Edition, Kingston, Massachusetts. 1996.
- Environment One Corporation, "Low-Pressure Sewer Systems Using Environment One Grinder Pumps." Schenectady, New York. February 1995.
- "Bid Tab — City of Hume, Missouri," EPA Project No. 9254001; personal communication with engineer. February 4, 1993.
About the Authors:
R. Paul Farrell, PE, joined Environment One Corporation as a charter employee in 1969 and began product design of the world's first commercial grinder pump. He has presented papers about pressure sewer application and operation at technical seminars at numerous colleges and universities and for the EPA. Farrell retired from Environment One in 1997 and currently serves as an industry consultant.
George A. Earle, PE, served as the Director of Engineering at Environment One Corporation from 1991 to 1999.
Editor's Note: This article was presented at the New England Water Environment Association's annual conference in Boston, MA, in January 1997.
E One may be reached at 2773 Balltown Road, Niskayuna, NY 12309-1090; Phone 518-346-6161.