
Danger Lurking In The Water: Offsetting Revenue Destruction In Our Water Utilities With The Smart Grid For Water

By Graham Symmonds, PE, chief knowledge officer, FATHOM
In our series on the Smart Grid for Water (see our first two installments “The Free Pathway To The Smart Grid For Water” and “Building The Business Case For The Smart Grid For Water”), we continue to build on the theme that the Smart Grid for Water is free. As we have seen, starting with the meter-to-customer vision, the deployment of an entirely new advanced metering infrastructure (AMI), highly functioning tools, and customer engagement platforms can be financed entirely within existing budgets.
In this part, we’ll examine how the Smart Grid for Water — in addition to reducing costs in existing budgets — finds revenue to offset the macro trend of declining revenue that threatens the financial sustainability of our utilities.
Increasing Efficiency Standards
There is no shortage of conditions that are lurking to take large bites out of utility revenue. Notably, tremendous advances have been made in reducing the amount of water we use. Modern, low-flow toilets, water-saving dishwashers and washing machines, automated irrigation controllers, faucet aerators, etc. have all been introduced in an effort to reduce potable water demand. And since the majority of utilities collect significant portions of their revenue from volumetric charges, the result is downward pressure on utility revenues.
And work on these efficiency measures continues. On April 8, 2015, the California Energy Commission approved new efficiency standards that further reduced the allowable maximum flow rates for the following water appliances:
- Toilets shall not consume more than 1.28 gallons per flush
- Urinals shall not consume more than 0.125 gallons per flush
- Residential lavatory faucets shall not exceed 1.2 gallons per minute flow rate
- Kitchen faucets shall not exceed 1.8 gallons per minute flow rate and may have capability to increase to 2.2 gallons per minute momentarily for filling pots and pans
- Public lavatory faucets shall not exceed 0.5 gallon per minute flow rate
As adoption of these efficiency standards advance, utilities sell less water. The latest data compiled by the USGS indicates that for the first time in 50 years, potable water deliveries in the U.S. actually declined.
Mandatory Revenue Destruction
In concert, there is a relatively new specter of mandated conservation — driven by regulations in response to long-term water resource pressures — that is starting to take a large bite out of utility revenue.
California is the shining example of this.

Source: Fallows C, Gallagher AJ, Hammerschlag N (2013) [Used under Creative Commons CC 2.5]
On April 1, 2015, the California State Water Resources Control Board (SWRCB), in the face of ongoing and severe drought, took action on the governor’s executive order to require that water providers reduce “potable water production” by an average of 25 percent across the state. While the average requirement was 25 percent, some water providers were required to demonstrate reductions of up to 36 percent.
And the people responded. Over two-thirds of the state’s water providers saved MORE than required. Great for water — not so great for the financial condition of our utilities.
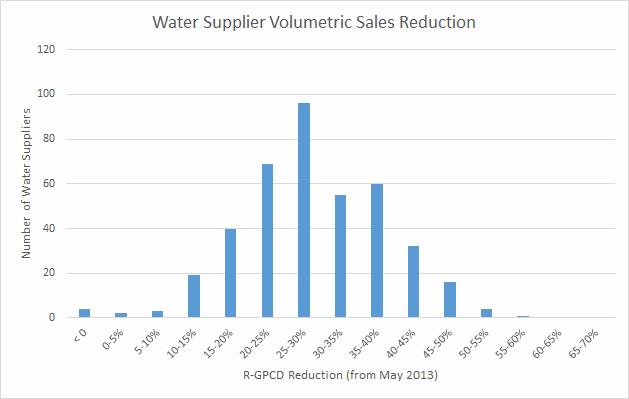
Data source: CSWRCB
There can be only one guaranteed outcome of this mandatory conservation: revenue destruction. The California SWRCB predicted as much in May 2015 when it concluded that statewide water utility net revenues were estimated to decrease between $500 and $600 million, equivalent to $14 to $17 per person.
And they were right. In October 2015, the Los Angeles Department of Water and Power reported facing a $111 million revenue shortfall as a result of decrease in water consumption of 10 percent more than expected. The Yorba Linda Water District, required to reduce its water production by 36 percent under California’s emergency drought regulations, expected a $9 million decline in revenue.
Show Me The Money
The combination of fixture efficiency, awareness, and voluntary and mandated conservation has resulted in a revenue crisis for our utilities — just at a time when more investment is needed to meet the problems of aging infrastructure, increasing costs, and increasingly stringent water quality regulations.
The American Water Works Association 2015 State of the Water Industry report noted that 47 percent of utilities were experiencing declining per account water sales while a further 33 percent reported flat or no change in sales. This means that a staggering 80 percent of utilities are facing real financial distress.
The Murky Waters Of Rate Increases
In response to this revenue destruction, many utilities respond with rate increases. While this presents a conundrum for customers (“I saved water so you’re charging me more?!?”), rate increases are one of the only tools available to utilities to respond to decreasing sales, as most utilities operate on a cash basis with most costs incurred irrespective of volume delivered: we still have to pay for the infrastructure even when using less water.
Complicating this approach, however, is that we are now in, or are rapidly approaching, the elastic point for the cost of water. As customer costs increase, the overall impact on their monthly budget increases. People then take active steps to reduce their costs. They use even less water. This drives rates up further. The elixir of raising rates is losing its potency: research shows that when our utilities seek large increases, the result is often less revenue than expected. That’s elasticity at work.
Finding Dollars In The Data
At FATHOM, we know that utility revenue is directly tied to the quality of data. Poorly maintained or poor quality control for the data used in generating bills means lost revenue. We have found that all utilities, regardless of size, age, or expertise, have revenue that is being lost in their data. The trick is to get it.
A fundamental aspect of revenue assurance is to connect and maintain the utility’s physical and logical assets. Utilities have to know where every meter is — in the real world and in their data systems. Unfortunately, through a lack of geospatial data in most utilities’ meter and billing systems, and the manual processes that are being used, it is very common that a utility’s physical assets — those in the ground — get decoupled from their logical assets — those in their data systems.
The result: lost revenue.
These errors can occur from a number of different sources and processes adding to the mounting financial crisis for our utilities:
- Meters missing from the billing inventory
- Water theft from bypassed meters
- Unauthorized connections
- Meter degradation and inaccuracy due to meter age or physical damage
- Meter degradation due to water quality or particulate precipitation
- Meter programming errors
- Meter installation errors reducing the accuracy of meters
- Improperly sized or specified meters
- Incorrectly mapped meters and customers
- Incorrect billing codes in the billing platform
- Human errors, including meter reading mistakes or estimates
All of these problems can be addressed through better spatial awareness and quality control and management of utility data. With the advent of software-as-a-service (SaaS) solutions, we can bring these techniques to the smallest utilities at very efficient cost, finding significant revenue streams that utilities are simply been missing.
FATHOM, with its geospatial meter data management platform bundled with state-of-the-art billing and customer presentment systems has been able to demonstrate annual revenue increases of $400,000 to $2 million (5 to 15 percent) for our utility partners, simply by ensuring that the physical and logical assets remain synchronized, and by modernizing the approach to billing.
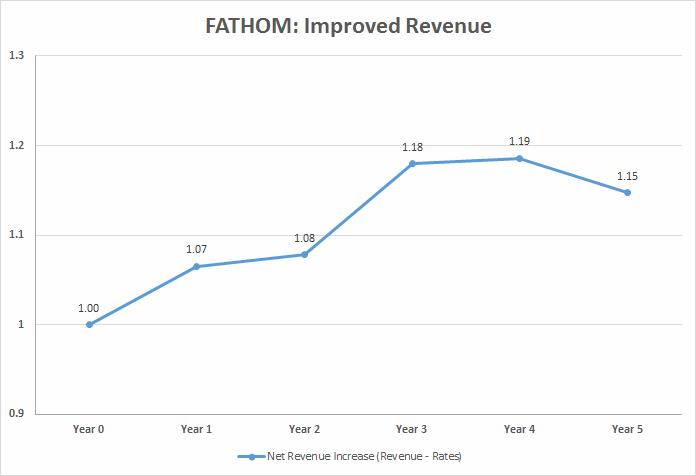
Source: FATHOM
Actively and automatically managing the data associated with meter reading, billing, and remittance management finds and maintains revenue for our utilities. Together with the efficiency and cost reduction mechanisms we discussed last time, the found revenue aspects of driving modernization of the meter-to-customer vertical further reinforces the self-funding nature of the Smart Grid for Water, allowing our utilities to transit the troubled waters of revenue destruction.
This pathway places our utilities on the launch pad to exploit the ancillary benefits of the Smart Grid for Water. In our next article, we’ll look at these benefits and how adopting a “Smart Water First” approach creates early wins and builds support for any smart city initiative.
Top image: © Lepidlizard (https://commons.wikimedia.org/wiki/File:Australian_Salt_Water_Crocodile.JPG)