
A 'SWIFT' Approach To Managed Aquifer Recharge
By Tyler Nading, with Larry Schimmoller, Dan Holloway, Ted Henifin, J. Dano, Germano Salazar-Benites, Chris Wilson, Charles Bott, and Jamie Mitchell
The Sustainable Water Initiative for Tomorrow (SWIFT) will not only restore declining levels to the Potomac Aquifer System, but it will also reduce nutrient discharges to the Chesapeake Bay.
Hampton Roads Sanitation District (HRSD) has developed an innovative program called the Sustainable Water Initiative for Tomorrow (SWIFT) that will address several regional environmental challenges through managed aquifer recharge (MAR). The ambitious program will provide advanced treatment to over 100 MGD of secondary effluent and inject the “SWIFT Water” into the Potomac Aquifer System (PAS).
HRSD is a regional wastewater treatment agency that owns and operates 13 wastewater treatment plants (WWTPs) in Southeastern Virginia. Seven of these facilities have been identified as candidates for SWIFT treatment and subsequent groundwater injection based on a facility’s location, secondary effluent quality, and other factors.
Program Drivers
The seven identified WWTPs all discharge into the Chesapeake Bay or its tributaries. Significant effort has been made in the Chesapeake Bay region to reduce nutrient discharges in the past decade. SWIFT provides an opportunity to reduce the nutrient load from these seven WWTPs by 90 percent, a significant benefit to the health of the Bay. HRSD also benefits from the reduction as it decreases its exposure to future nutrient reduction requirements and allows nutrient credit trading agreements in the region.
Another major driver for SWIFT is the status of the PAS, which has experienced rapidly declining aquifer levels over the past century. The PAS is a large, confined aquifer, and withdrawal rates have far exceeded the natural replenishment rate and the existing recharge and replenishment efforts in the region. The declining levels have resulted in reduced withdrawal permits, land subsidence, and saltwater intrusion. Regional modeling has demonstrated that SWIFT will provide significant benefit to the PAS with its 100-plus MGD of recharge.
Concept Evaluation
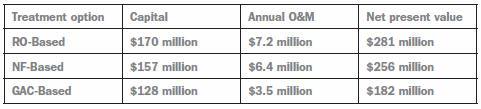
The SWIFT program began in Virginia with a feasibility assessment to identify potential treatment trains to achieve a level of advanced water treatment (AWT) that meets all primary drinking water standards and provides multiple barriers to pathogens and organics. Three viable treatment trains were identified, and Class 5 capital and operating cost estimates were generated to provide a high-level comparison. Figures 1 through 3 provide process flow diagrams of the candidate treatment processes, while Table 1 presents the net present value cost of a 20-MGD facility for each option.
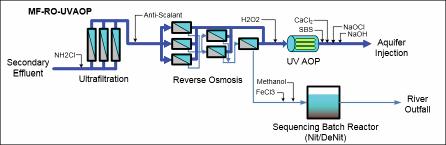
Figure 1. Process flow diagram for reverse osmosis (RO)-based option
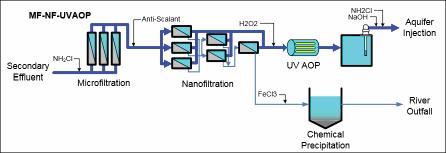
Figure 2. Process flow diagram for nanofiltration (NF)-based option
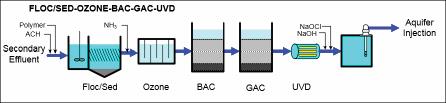
Figure 3. Process flow diagram for granular activated carbon (GAC)-based option
Table 1. Net Present Value Cost of 20 MGD AWT Facility
At the concept evaluation phase, multiple regional groundwater modeling scenarios were evaluated to better understand the impact of various injection flows and timelines. The results of two scenarios are shown in Figure 4. The figure on the left provides a 50-year baseline outlook without SWIFT recharge and shows aquifer levels declining to levels reaching 200 feet below sea level. The figure on the right shows a significant benefit after 50 years of over 100 MGD of SWIFT recharge.
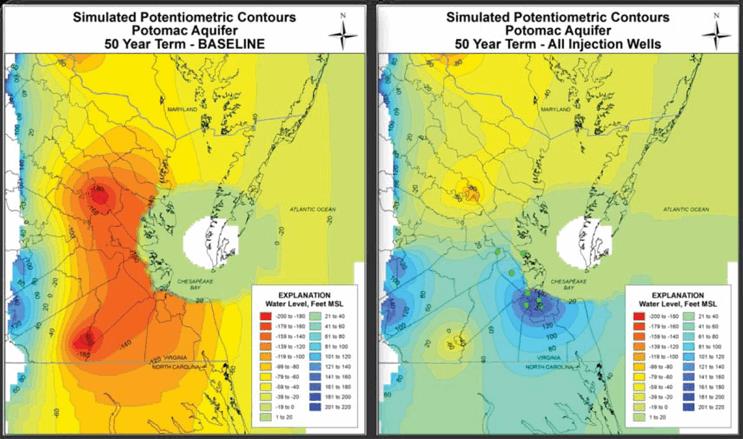
Figure 4. Results of regional groundwater modeling for baseline and SWIFT scenarios
Another part of the groundwater modeling evaluation was analysis of the travel time as the water moves through the aquifer. Due to the large size of the PAS, it was estimated using several different analytical methods that the average velocity of the recharge water would be 29 feet per year, thus taking 180 years to travel one mile from the injection well.
Pilot Testing And Test Well Analysis
In December 2015, HRSD elected to proceed with two critical program steps: pilot testing of treatment processes and the drilling of a test well. The pilot testing included two side-by-side AWT processes: the RO-based and GAC-based trains. This side-by-side analysis allowed real-time comparison of the AWT effluent to ensure that the identified treatment goals could be met.
Pilot operation began in June 2016, and a rigorous sampling campaign was initiated to quantify performance at each stage in the process. The RO-based train was operated until December 2016, while the GAC-based train has continued in operation through 2017 to provide insight on performance as the GAC became exhausted. All treatment goals were achieved through testing, but results are not included in this article. Figures 5 and 6 show pictures of the pilot testing equipment.
Drilling a test well allowed hydraulic and geochemical analysis to confirm the assumptions made in the concept evaluation phase. The hydraulic analysis consisted of a step drawdown test, a 24-hour constant rate test, and packer testing in each of the three primary zones of the PAS. This testing showed a specific capacity approaching 50 gpm per foot, confirming it is hydraulically well-suited for recharge.
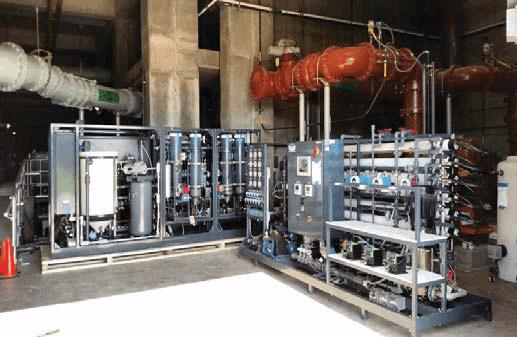
Figure 5. RO-based pilot treatment skids
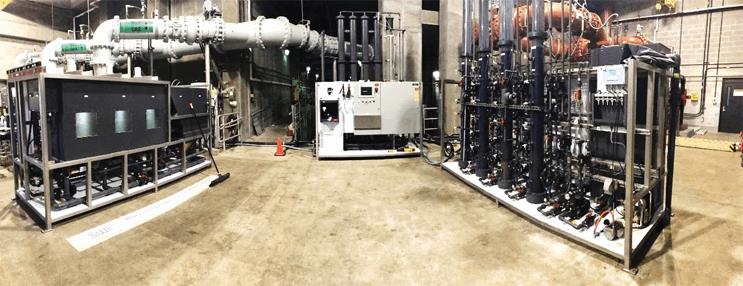
Figure 6. GAC-based pilot treatment skids
Results from the test well showed high total dissolved solids (TDS) levels in all three aquifer zones, ranging from 1,500 mg/L in the upper zone to 4,500 mg/L in the lower zone. Geochemical analysis established a goal of having recharge water within one order of magnitude in ionic strength relative to the native groundwater, which would require a significant increase of sodium chloride to the RO effluent. The analysis also identified a target recharge pH of 7.8 and a conditioning program prior to recharge consisting of an aluminum chloride solution to stabilize the clays around the well. Figure 7 provides a picture of the initial test well.
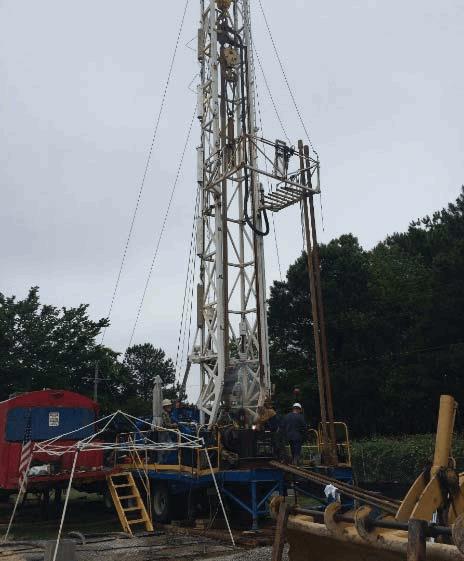
Figure 7. Test well located at York River Treatment Plant
SWIFT Research Center
Instead of advancing directly to full-scale, HRSD elected to build a 1-MGD Research Center to demonstrate at a meaningful scale that SWIFT treatment will produce water that meets primary drinking water standards and is compatible with the PAS. The GAC-based treatment process was selected for the Research Center based on its pilot performance, preferential cost, avoidance of brine treatment and discharge challenges, and projected compatibility with the native groundwater. Figure 8 shows a rendering of the Research Center as provided by Hazen and Sawyer, P.C., the selected design firm.
Construction of the Research Center began in April 2017, and facility startup will occur in January 2018. After several months of documented performance, aquifer recharge is expected to begin in April 2018, at a flow rate of 1 MGD. In addition to the thorough sampling and process monitoring that will occur within the Research Center, several monitoring wells will be used to quantify additional treatment provided as the recharge water moves through the aquifer. Results from the monitoring wells will be compared to soil column testing being performed by HRSD to establish assumptions for aquifer treatment of SWIFT Water.
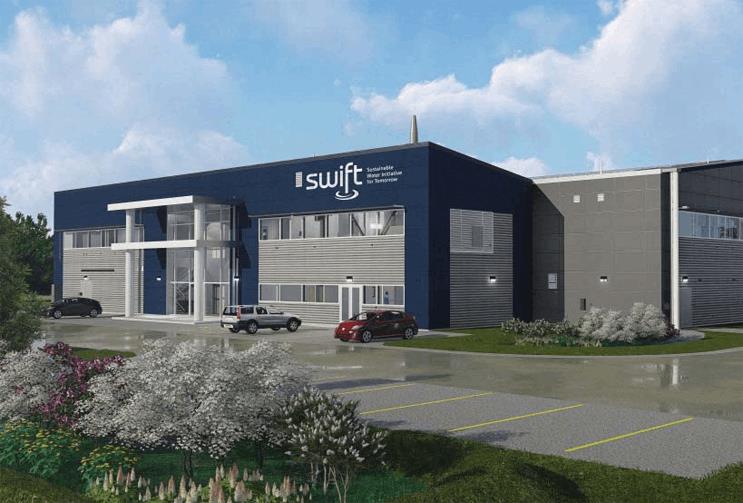
Figure 8. SWIFT Research Center rendering
Regulatory Approach
Because the Commonwealth of Virginia has not accepted delegation of the Underground Injection Control (UIC) program, the U.S. EPA holds primacy over the permit. However, the EPA has solicited input from the Virginia Department of Health (VDH) and the Virginia Department of Environmental Quality (DEQ) throughout the process. Since the program’s inception, HRSD has held open workshops with all regulatory stakeholders (EPA, VDH, and DEQ), as well as a variety of regional stakeholders, to ensure that all parties are aligned with the program’s strategy. This approach has helped HRSD reduce the risk of a future roadblock, whether it comes from regulatory agencies, regional agencies, or the public.
Table 2. SWIFT Research Center Proposed Regulatory Limits for SWIFT Water
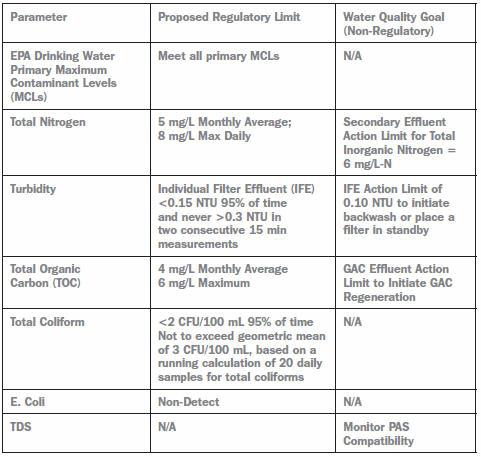
Table 3. SWIFT Research Center Non-Regulatory Performance Indicators
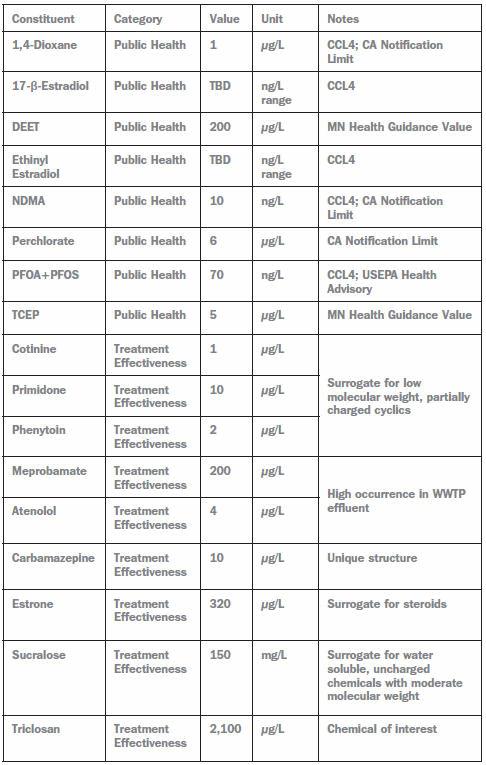
Table 2 lists the regulatory limits that will be proposed for the SWIFT Research Center. These limits will be reviewed during operation of the Research Center and may be revised for future full-scale facilities based on the AWT performance and the documented treatment performance in the aquifer. A series of non-regulatory parameters has also been identified to be monitored in the SWIFT Water and in the aquifer. These are non-regulated trace organics that are widely discussed in the potable reuse community. An action level has been identified for each parameter based on guidance from the Final Report of an NWRI Independent Advisory Panel: “Recommended DPR General Guidelines and Operational Requirements for New Mexico, 2016.” If the parameter exceeds the action value, HRSD will work to decrease the value in the SWIFT Water, either by source control or improved treatment. Table 3 provides the non-regulatory performance indicators.
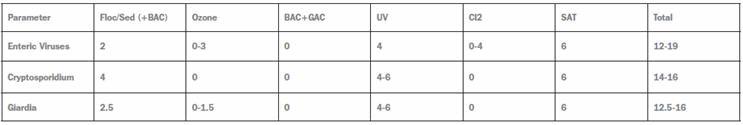
The regulatory approach does not include specific requirements for pathogen inactivation log reduction values (LRVs); however, the treatment process has been designed and will be operated to achieve the pathogen inactivation shown in Table 4. Ozone inactivation will target 3-log virus removal and 1.5-log Giardia removal but may be reduced if bromate formation limits the allowable ozone dose. 6-log Cryptosporidium and Giardia inactivation is assumed for UV disinfection at a dose of 186 millijoules per square centimeter (mJ/cm2) based on extrapolation of Table 1.4 in the Ultraviolet Disinfection Guidance Manual for the Final Long Term 2 Enhanced Surface Water Treatment Rule, even though no states currently acknowledge more than 4-log removal for UV without advanced oxidation.
Table 4. SWIFT Research Center Pathogen LRV for PAS Recharge Water
Full-Scale Implementation
Eighteen months of Research Center operational data will be collected and reviewed to inform the design criteria for the full-scale facilities. Over 100 MGD of SWIFT facility capacity is planned to be operational by 2030, with the first full-scale facility targeting operation by 2022. In addition to design and construction of the SWIFT facilities, HRSD will evaluate what improvements to the existing WWTPs are required in order to produce a robust and consistently highquality secondary effluent. The most notable challenge is to produce consistently low secondary effluent nitrogen values (ammonia, nitrite, and nitrate) throughout the day, given the typical influent diurnal load variation.
About The Author
 Tyler Nading is a project technologist with CH2M focused on water reuse projects. He has 10 years of experience with CH2M and a wide range of experience, including master planning, design, pilot testing, construction and startup, and operational troubleshooting. Tyler has a BS in Civil Engineering from Washington University in St. Louis.
Coauthors: Larry Schimmoller and Dan Holloway are with CH2M; Ted Henifin, J. Dano, Germano Salazar-Benites, Chris Wilson, Charles Bott, and Jamie Mitchell are with HRSD, Virginia Beach.