
What Utilities Should Know About School Lead Data

By Kevin Westerling,
@KevinOnWater

Utilities are about to spend a lot more time thinking about schools.
Under the Lead and Copper Rule Improvements (LCRI), community water systems will need to identify covered schools and childcare facilities, conduct outreach, and carry out required sampling. Existing state data can provide a useful head start, but utilities should know what they are looking at before relying on it.
TapWaterData has done much of the initial legwork in a state-by-state school lead-testing scorecard covering all 50 states and the District of Columbia. The page links to each jurisdiction's source, notes whether findings were confirmed directly, and describes the coverage and age of the published results. For utilities beginning to assemble facility lists or review earlier testing, it's worth bookmarking.
The first headline is that 46 of 51 jurisdictions publish at least some school lead-testing results, compared with 26 in the National Association of State Boards of Education's 2021 baseline. But most of that increase reflects unresolved entries in the earlier survey, not new state programs: seven states began publishing, 14 were listed as unknown in 2021, and Georgia went backward. Another five publish nothing TapWaterData could find, although one of those findings has not been confirmed directly.
The more important headline is that publication alone says little about usefulness. Only eight jurisdictions cover essentially every school. Twenty-eight publish for some schools, three publish for very few schools, and seven have not yet been rated for breadth.
A Published Result May Be Only A Snapshot
State programs differ widely. Some are mandatory, others voluntary. Some cover a rolling group of schools, while others reflect a one-time grant round. California and Maine published broad statewide datasets, but both programs have ended. Iowa publishes results for four organizations, 28 buildings, and 119 tests in a state with roughly 1,300 public schools.
Georgia presents a different problem. Its portal is live and lists 43 facilities, but none has results attached. North Carolina uses the same platform and lists 10,509 facilities, including 2,089 with results. A working dashboard is not necessarily a populated one.
For utilities, this means a state portal should be treated as a starting point rather than a compliance inventory. Confirm who participated, when sampling occurred, whether the program is still active, and whether the records cover schools, childcare facilities, or both.
Do Not Rank States By Their Exceedance Rates
The TapWaterData scorecard deliberately avoids ranking states by the percentage of results above an action level, and for good reason. State thresholds range from 1 ppb to 20 ppb. A state using 1 ppb is not measuring the same outcome as one using 20 ppb, even if both columns are labeled "percent above the action level."
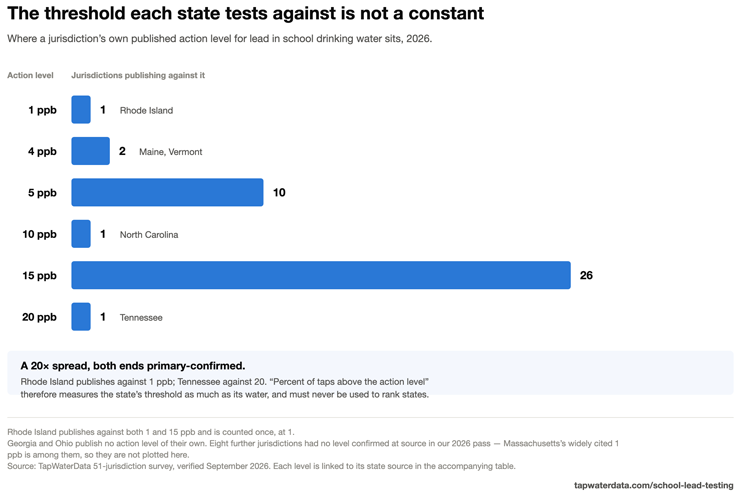
State action levels span a 20-fold range, making a simple ranking of exceedance rates misleading. The corrected graphic reflects the September 2026 survey; consult the live scorecard for the latest jurisdiction details. Source: TapWaterData.
The reporting methods also differ. Some states publish one row per fixture, others one row per school. Some identify results below the laboratory's detection limit, while others enter a numerical value without explaining whether it is a measured concentration or a reporting floor. Participation may be mandatory, voluntary, or limited to a grant-funded cohort.
TapWaterData currently holds row-level data for seven states, but only California, North Carolina, and Washington supported a direct comparison at a common 15-ppb threshold. Kansas, Virginia, and West Virginia did not clearly identify non-detects, while New York reported by school instead of fixture. The comparison was withheld for those four rather than force incompatible data into the same calculation.
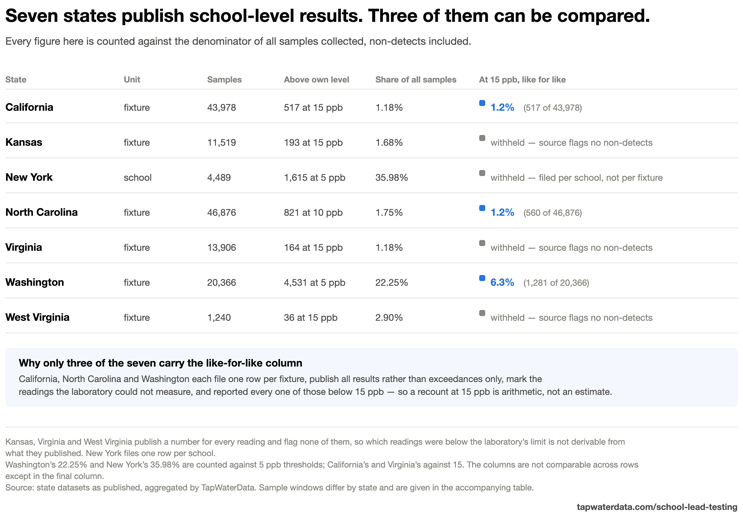 Only three of the seven row-level state datasets supported a like-for-like comparison at 15 ppb. Source: TapWaterData.
What Utilities Should Take From It
The scorecard can help utilities identify facilities, locate earlier sampling, find remediation records, and see where state or local work may overlap with LCRI obligations. It can also expose gaps that utilities will need to close through billing records, school directories, childcare licensing lists, and service-line inventories.
Just keep the qualifiers with the data.
Before using a state result, note its date, coverage, threshold, unit of analysis, participation rules, and treatment of non-detects. Those details determine whether the record is useful for planning, public communication, or comparison.
The short version is this: more school lead data is public than the old national references suggest, but it is still a patchwork. Utilities can review the full findings, methodology, and jurisdiction-level sources at TapWaterData's school lead-testing page.