
Real-Time Water Quality Monitoring: How Smart Sensors And IoT Are Improving Utility Performance
Water quality monitoring has traditionally depended on scheduled sampling, laboratory testing, and periodic field measurements. While these approaches remain important for regulatory compliance and detailed assessment, they provide only snapshots of conditions that can change quickly due to rainfall, runoff, source-water fluctuations, industrial discharges, treatment changes, and hydraulic events. Smart sensors and IoT-enabled monitoring are helping utilities move toward continuous visibility by tracking parameters such as turbidity, pH, conductivity, temperature, and dissolved oxygen. This allows operators to identify unusual changes earlier, investigate potential causes, and improve decision-making across treatment and distribution systems.
The adoption of connected monitoring technologies is also expanding as utilities focus on infrastructure modernization, operational efficiency, and proactive water management. DataIntelo research indicates that the global smart water quality sensor market reached USD 1.38 billion in 2024 and is projected to reach USD 3.98 billion by 2033, representing a CAGR of 12.4%. This expansion highlights the increasing role of real-time sensing, automated data collection, remote monitoring, and analytics in helping utilities improve visibility, respond to changing water conditions, and strengthen overall system performance.
Why Real-Time Water Quality Data Matters
Water conditions can change rapidly because of heavy rainfall, source-water disturbances, industrial discharges, treatment-process changes, or hydraulic events. Conventional sampling may miss short-lived changes because samples are collected at defined intervals. Real-time monitoring provides a continuous operational record and allows utilities to investigate abnormal conditions while they develop.
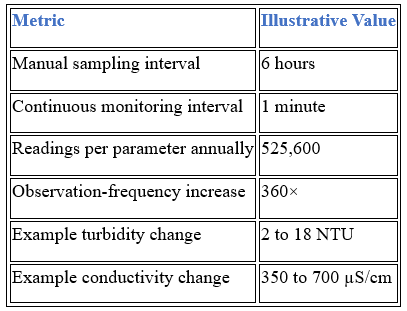
Online systems can measure turbidity, pH, conductivity, temperature, dissolved oxygen, and oxidation-reduction potential. Each measurement provides a different signal. For example, a turbidity increases from 2 NTU to 18 NTU represents a ninefold rise. It does not identify the cause automatically, but it can prompt investigation of coagulation, filtration, upstream conditions, or instrumentation. Conductivity increasing from 350 µS/cm to 700 µS/cm represents a 100% increase and may indicate altered dissolved ionic content.
Smart Sensors Turn Water Chemistry Into Live Data
Modern multiparameter instruments can continuously measure several variables at one location. A station recording five parameters every minute produces 2,628,000 individual parameter readings annually. One parameter alone produces 525,600 readings. This scale demonstrates the challenge of continuous monitoring.
More measurements provide greater visibility, but utilities must identify missing data, sensor drift, calibration problems, fouling, and genuine water-quality changes. A dashboard is not automatically useful. Data must be validated, contextualized, and connected to actions.
IoT Connects Sensors With Utility Operations
The Internet of Things connects field measurements with utility systems. A typical architecture can include sensors, edge gateways, communication networks, supervisory control systems, databases, analytics platforms, and operator dashboards.
Edge processing can validate readings locally, identify outliers, and store information during communication interruptions. Centralized analytics can calculate trends, compare values with operating ranges, and generate alerts. Treatment plants may use wired networks, while remote reservoirs and distribution assets may depend on cellular or low-power wireless connectivity. Utilities should evaluate availability, power consumption, latency, cybersecurity, and maintenance requirements before selecting communications technology.
Continuous Monitoring Can Improve Treatment Decisions
Raw-water quality may change significantly during storms. Suppose a plant normally records turbidity near 2 NTU and the value reaches 18 NTU within 20 minutes. The change can trigger investigation of rainfall, dosing, flow, filter performance, upstream conditions, and sensor status.
The sensor does not determine the cause. Instead, it supplies an early signal that can be compared with operational information. Measurement should trigger investigation, while verified information should support intervention. Continuous data also reveals whether a change is gradual, sudden, temporary, or persistent.
Distribution Systems Require Strategic Monitoring
Distribution networks can extend across hundreds of kilometres and include reservoirs, pressure zones, storage facilities, and dead-end sections. Monitoring every point may be expensive. Strategic placement can provide stronger coverage by prioritizing locations with historical variability, operational importance, or greater exposure to disturbances.
Combining water-quality measurements with hydraulic information can improve diagnosis. For example, if conductivity rises 40% while pressure and flow also change, operators have more context than conductivity alone provides. A network using six-hour manual sampling could, at selected critical locations, shift toward one-minute observation, increasing observation frequency by 360 times.
Analytics Can Identify Unusual Patterns
Real-time datasets can support statistical models and machine learning. Instead of relying entirely on fixed thresholds, analytics can establish normal operating baselines and identify deviations.
Consider turbidity normally ranging from 0.5 to 2.0 NTU. A reading of 2.2 NTU may not require an emergency response. However, if turbidity rises from 0.8 to 2.2 NTU while conductivity increases 25%, pressure falls 10%, and flow changes simultaneously, the combined pattern could justify investigation. This approach shifts monitoring from isolated alarms toward contextual anomaly detection.
Analytical performance depends on data quality. Models trained on representative records are more reliable than models built from incomplete data.
Sensor Maintenance Remains Critical
Continuous monitoring depends on sensor reliability. Fouling, calibration drift, damaged probes, air bubbles, temperature effects, and unsuitable installation conditions can affect readings. Utilities should establish appropriate calibration and verification schedules.
Online measurements can be periodically compared with laboratory results to identify drift. Automated data-quality rules can flag questionable readings. For example, an 800% turbidity increase within one minute, without corresponding changes in nearby parameters, may warrant verification before classification as a water-quality event.
Measuring Utility Performance
Utilities should evaluate monitoring by operational outcomes rather than sensor counts.
If manual sampling previously required four hours to identify an event while an online system generated an alert within 10 minutes, the information delay would theoretically decrease by about 96%.
From More Data To Better Decisions
The value of real-time monitoring is measured by reduced uncertainty, faster detection, improved process control, or earlier warning of abnormal conditions. Utilities do not need to connect every asset simultaneously. They should prioritize locations where continuous information can shorten the time between an abnormal condition and an informed response.
A treatment plant may begin with turbidity and conductivity, while a distribution utility may prioritize pressure zones or reservoirs. Effective systems connect measurements with clear operating procedures. An alarm without an assigned response has limited value.
Real-time water-quality monitoring is therefore not about collecting the largest possible volume of data. It is about reducing the time between a change occurring, the utility detecting it, and an informed decision being made. Smart sensors and IoT provide the infrastructure, but reliable performance ultimately depends on data quality, engineering judgment, maintenance discipline, and effective integration into daily utility operations for better decisions.
Reference: https://dataintelo.com/report/smart-water-quality-sensor-market
Source: DataIntelo