
Precision And Accuracy Of Multiple Stormwater Laboratory Testing Methodologies
By James Mailloux
There are several accepted methodologies for testing stormwater treatment devices in the lab, but what works best? A comparison study gets us closer to the goal of optimal sediment removal efficiency.
Laboratory testing of manufactured treatment devices (MTDs) allows research engineers to have control over the test parameters, theoretically enabling the production of accurate and repeatable test data. There are multiple accepted testing methodologies being utilized for conducting laboratory protocol testing, though we may not have a full understanding of their overall and comparative efficacy.
An established testing protocol, developed by industry experts and accepted by many agencies, is the “New Jersey Department of Environmental Protection Laboratory Protocol to Assess Total Suspended Solids Removal by a Hydrodynamic Sedimentation Manufactured Treatment Device” (2013). Under this protocol, sediment removal efficiency testing can be performed utilizing the mass balance (MB) or various sampling methodologies. Although accepted in industry, there is little published data on the precision and accuracy of the listed methodologies with regard to sediment removal efficiency. Ideally, all methods would produce comparable results. However, a review of published reports has shown differences between the methodologies when utilized on the same treatment system with similar sediment particle size distribution.
The main difference between MB and sampling is that MB uses the captured mass and injected mass of sediment to produce a single removal efficiency value, as opposed to sampling, which uses the calculated influent concentration and average of “snapshots” of the effluent concentration to determine the overall removal efficiency.
Alden Research Laboratory (Holden, MA) conducted research testing that allowed for a direct comparison of the various accepted methodologies.
The NJDEP laboratory testing protocol was followed for testing consistency; however, the results would be applicable for any similar laboratory testing.
Experimental Design
Testing was performed on a 4-foot-diameter stormwater MTD, at two selected flows of 0.25 cubic feet per second (cfs) and 1.0 cfs. Four tests were conducted at each flow to assess repeatability, while utilizing the following methodologies in accordance with the New Jersey Department of Environmental Protection (NJDEP) protocol.
a) Mass balance
b) End-of-pipe effluent sampling, 2-L beaker (EOP-2L)
c) End-of-pipe effluent sampling, 1-L bottle (EOP-1L)
d) In-line effluent sampling, 1-L bottle
e) Isokinetic effluent sampling, 2-L beaker
Scatter among the effluent sample concentrations was expected, due to the turbulent outflow conditions, especially at the higher flow conditions. The data was evaluated to see if each sampling methodology produced similar concentration scatter and sediment removal efficiency.
System Setup
The test unit was installed in the Alden test loop, which is configured as a recirculating system. Flow was supplied to the test unit with a laboratory pump drawing water from a supply sump. The test flow was set and measured using a control valve and calibrated orifice-plate flow meter. A differential pressure (DP) cell and computer data acquisition (DA) program was used to measure and record the test flow every 5 to 10 seconds (flow dependent) throughout each test. Flow measurement accuracy was within ±1 percent. Flow was conveyed to the test unit by means of a straight smooth-wall influent pipe. Effluent piping returned the flow back to the sump as a free-discharge after it had passed through the test unit. A calibrated volumetric screw feeder discharged the test sediment into a tee within the crown of the influent pipe to produce an influent concentration of 200 mg/L (± 10 percent). The effluent pipe contained three calibrated isokinetic sampling tubes, as well as an access opening in the crown of the pipe, for collecting in-line effluent samples. An isokinetic sampler was installed in the vertical riser upstream of the influent pipe run, for collection of background samples. The end-of-pipe sampling was conducted at the free-discharge of the outlet pipe.
Testing
Sediment test batches of approximately 30 pounds were prepared in separate 5-gallon buckets, which was quantified and recorded prior to testing. The influent concentration was verified by collecting a minimum of six timed samples at the injector. The total mass injected into the unit was quantified by subtracting the mass remaining at the completion of a test from the starting mass. This value was correlated with the total volume of water introduced during sediment dosing to produce the reported influent concentration values (mass/volume concentration, mg/L). Fifteen effluent samples were collected for each sampling methodology utilized. Each numbered sample set was collected in the following order: 1) EOP-2L, 2) EOP-1L, 3) in-line, and 4) isokinetic samplers (1.0 cfs tests only). A background sample was collected with each odd-numbered sample set, for a total of eight samples. A 3rd-order curve and corresponding equation was fitted to the background data and used to adjust the effluent sample concentrations.
Mass Balance
A modified mass balance method in which the injected and captured sediment mass are quantified was used to determine the sediment removal efficiency at each designated test flow. All captured material was collected in designated pre-weighed, nonferrous trays and dried in a laboratory oven in accordance with ASTM Method D 4959-16. Each tray was weighed on a calibrated digital scale.
Effluent Sampling
EOP, in-line, and isokinetic sampling methodologies were utilized to quantify the removal efficiency for the study. Collection of samples using each methodology was performed as simultaneously as possible, with an estimated timeframe of 10 to 15 seconds for each sample set. All sampling methodologies were utilized for the 1.0 cfs test condition (>0.5 cfs). Only the EOP and in-line sampling were performed during the 0.25 cfs tests (<0.5 cfs).
The EOP sampling was conducted by sweeping the designated sample container through the full free-discharge of the outlet pipe. Two sets of samples were collected, one using open-top 2-liter beakers and the other using 1-liter wide-mouth bottles.
In-line effluent samples were collected using 1-liter wide-mouth bottles introduced through a 12-inch access hole cut in the crown of the pipe. The sample bottle was fully inserted into the center of the flow stream.
Three isokinetic sampling tubes were evenly spaced in the water column (25, 50, and 75 percent water depth) along the vertical centerline of the effluent pipe. Flow from all three samplers was collected as a composite using an open-top 2-liter beaker.
Sample Concentration Analyses
Effluent and background concentration samples were analyzed at Alden in accordance with ASTM Designation: D 3977-97 (Reapproved 2013), “Standard Test Methods for Determining Sediment Concentration in Water Samples.”
Test Sediment
The test sediment power spectral density (PSD) was a gradation of 1 to 1000 microns, which was prepared by Alden to meet the NJDEP protocol. The specific gravity (SG) of the sediment mix was 2.65. Well-mixed samples were collected from random test batches and analyzed for PSD by an independent analytical laboratory. The D50 of the samples ranged from 60 to 75 microns, with an average of 68 microns.
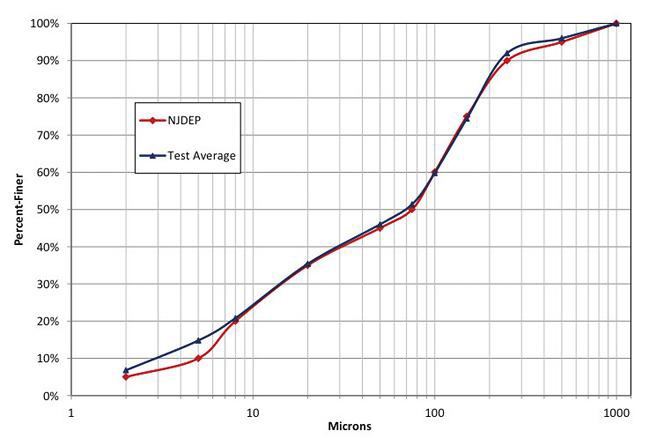
Figure 1. PSD curves of 1-1000 micron test sediment and NJDEP specifications
Calculation Of Removal Efficiency
The mass balance sediment removal efficiency was calculated using the following equation:

The sampling sediment removal efficiencies were calculated using the following equation:

(Effluent concentrations were adjusted for background concentration and averaged prior to calculating the removal efficiency for each sampling methodology.)
Testing Results And Discussion
0.25 cfs (112 gpm)
The mass balance results for the four tests ranged from 54.6 to 56.1 percent, with an average removal efficiency of 55.4 percent.
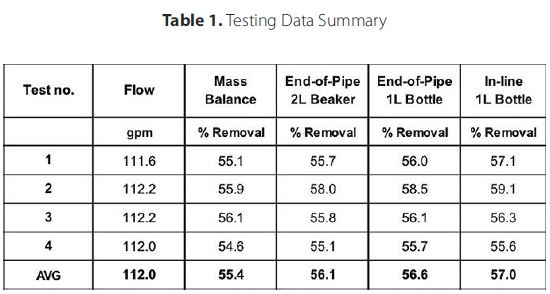
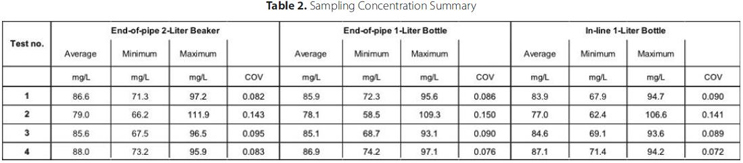
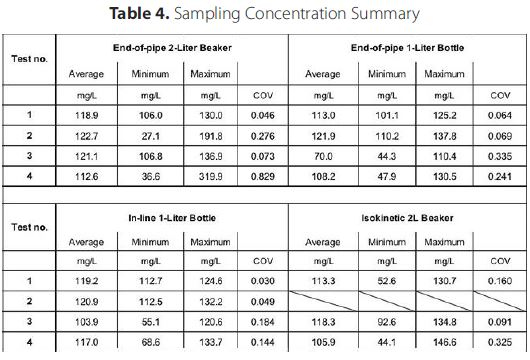
The three tested sampling methodologies produced comparable results, with average removal efficiencies of 56.1, 56.6, and 57.0 percent. All individual grab sampling results, except Test #4 EOP-2L, were above the MB average. The testing removal efficiency data summary is shown in Table 1 and corresponding graph is shown on Figure 2. The effluent sampling summary is shown in Table 2.
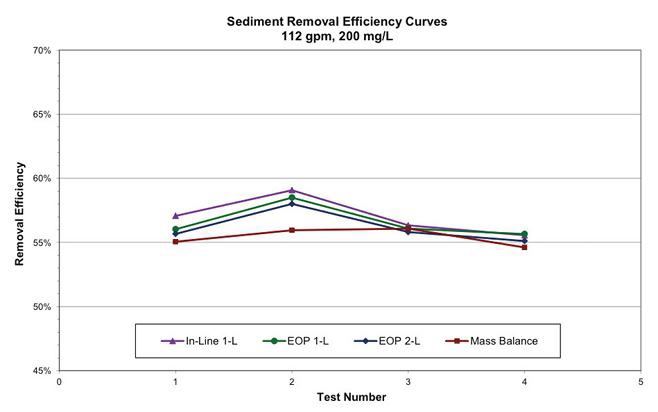
Figure 2. Measured removal efficiencies
The measured effluent concentration scatter of each sampling methodology was fairly consistent for all four tests conducted, with no definitive outliers. This indicates that each methodology is equally capable of collecting a representative sample at a low-flow condition. The effluent sample plots for Test #2, which had the highest coefficient of variance (COV), are shown on Figure 3.
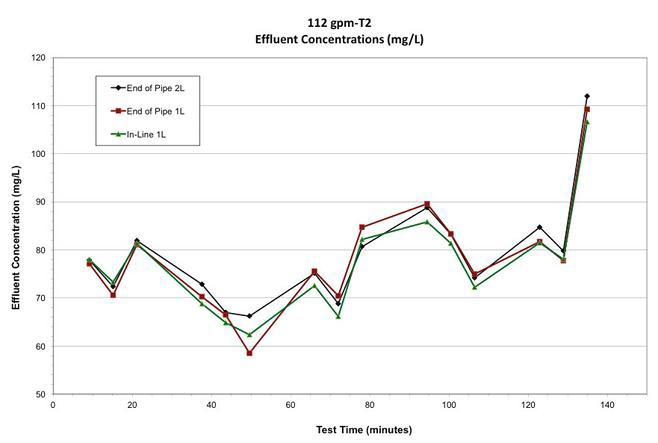
Figure 3. Test #2 - Effluent sample concentrations
1.0 cfs (448 gpm)
Four tests were conducted to assess a “high-flow” condition for a 4-foot treatment unit. The effluent sampling included the EOP-2L, EOP-1L, in-line, and isokinetic sampling methodologies. Only three tests were conducted with the isokinetic samplers. The decision not to utilize the isokinetic samplers in Test #2 was made after review of published reports revealed that isokinetic samplers did not appear to be utilized in previous NJDEP protocol testing. A new NJDEP report was released shortly after conducting Test #2, which included the isokinetic samplers for the high-flow conditions and as a result, the samplers were included in Tests #3 and #4. Although not used, the isokinetic samplers were not removed from the effluent pipe during Test #2.
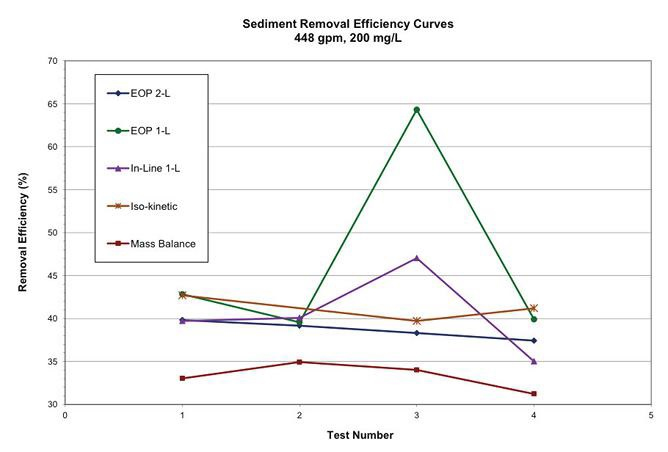
Figure 4. Measured removal efficiencies
The mass balance results for the four tests were fairly consistent, ranging from 31.2 to 34.9 percent, with an average removal efficiency of 33.3 percent.
The four tested sampling methodologies produced higher removal efficiencies than the average MB removal for all tests conducted. The average sampling removal efficiencies were 38.7, 46.6, 40.5, and 41.2 percent. The maximum calculated sampling removal efficiency was 64.3 percent.
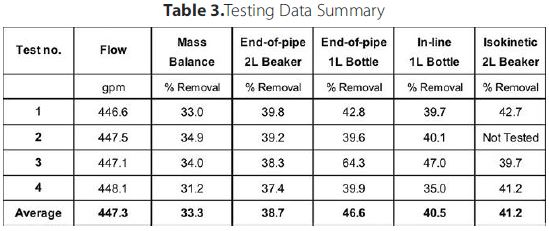
The measured scatter in the effluent concentrations was not as consistent as seen in the low-flow tests. Each test and sampling method produced unexplained outliers.
Test #1:
The EOP-2L and EOP-1L samples produced the minimum and maximum concentration spread of corresponding samples (not including outliers), which ranged from 2.6 mg/L (sample #6) to 28.9 mg/L (sample #14). The isokinetic sample #12 concentration was 52.6 mg/L, which is considered an outlier. Omitting the single outlier would drop the removal efficiency from 42.7 to 40.5 percent.
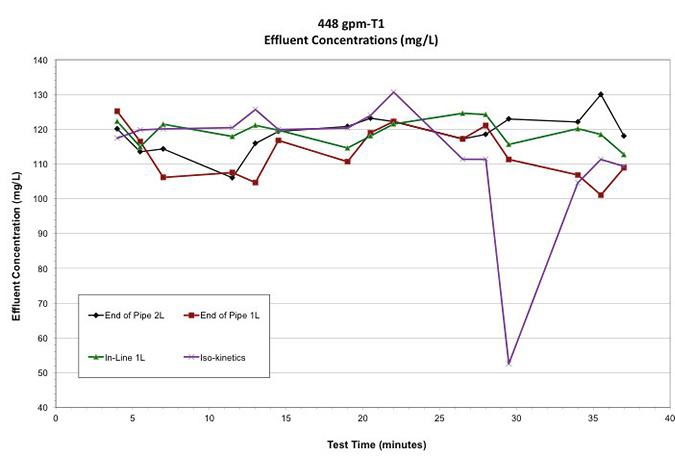
Figure 5. Test #1 - Effluent sample concentrations
Test #2:
Test #2 produced the most consistent trends overall. However, this test also produced an outlier spread of approximately 160 mg/L for samples #10 and #12 using the EOP-2L method. By chance, the outliers were fairly uniform from the average (approximately ± 80 mg/L) and, consequently, the overall average and calculated removal efficiency were not appreciably affected.
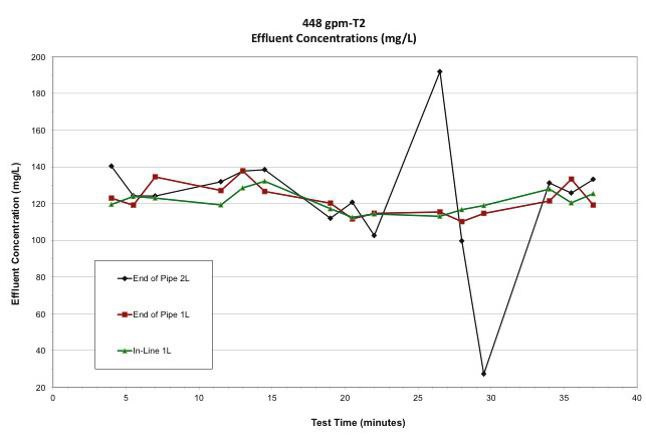
Figure 6. Test #2 - Effluent sample concentrations
Test #3:
The EOP-1L sampling method produced uncharacteristically low effluent concentrations for most of the samples, with the first six samples ranging from 44.3 to 52.1 mg/L. In addition, the in-line method produced two low outliers of 55.1 and 62.5 mg/L at samples #10 and #11, respectively.
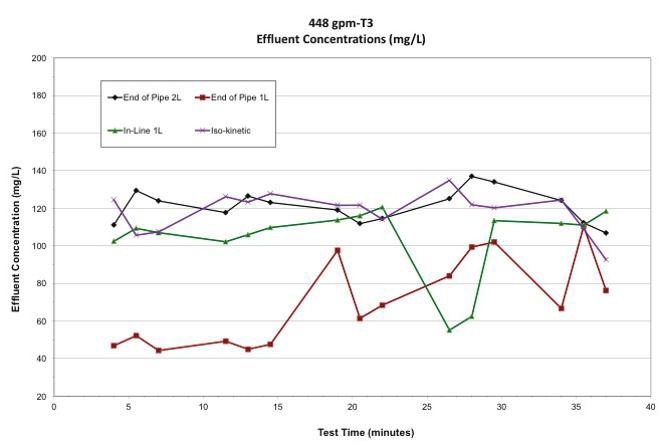
Figure 7. Test #3 - Effluent sample concentrations
Test #4:
The EOP-2L samples #1-3 and #7-12 were well below the expected concentration values. These samples were followed by the highest concentrations recorded for any of the tests conducted. The high values could be attributed to scouring of captured sediment.
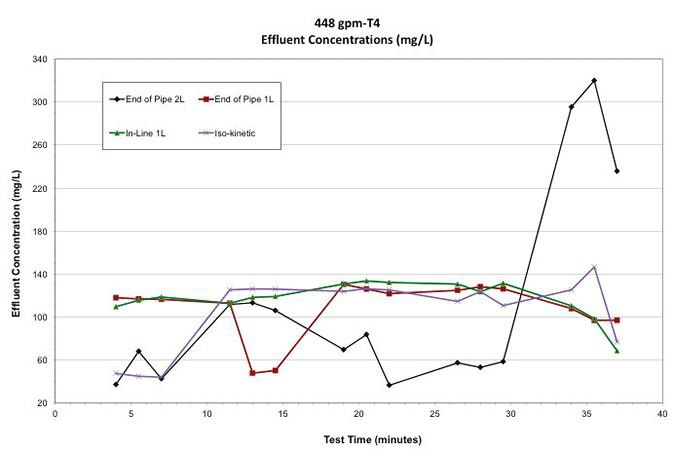
Figure 8. Test #4 - Effluent sample concentrations
However, the increased concentrations were not mirrored by any of the other sampling methods and, therefore, are considered outliers. The EOP-1L concentrations were low at #5 and #6. Omitting the two samples would lower the removal efficiency from 39.9 to 34.9 percent. Isokinetic samples #1-3 were also well below the remaining concentrations. Not including those samples would lower the efficiency from 41.2 to 32.8 percent. The in-line samples were the most consistent. All sampling methods showed a drop in concentration at the end. This drop was expected, as the sediment feed rate also dropped at the end of the test.
Summary
The 0.25 cfs tests produced similar and repeatable results for the mass balance and grab sample methodologies. The measured effluent concentrations and scatter trends were similar for corresponding samples using each sampling methodology.
The 1.0 cfs tests produced individual mass balance results that were ± 2 percentage points of the four-test average. The individual sampling sediment removal efficiency results ranged from approximately 4 to 30 percentage points higher than the mass balance average and the sampling averages ranged from 5.4 to 13.3 percent higher. In addition, the effluent sampling methodologies produced numerous outliers and inconsistent effluent concentrations.
References
- ASTM (2013), “Standard Test Methods for Determining Sediment Concentration in Water Samples,” Annual Book of ASTM Standards, D3977-97, Vol. 11.02.
- ASTM (2007), “Standard Test Method for Particle Size Analysis of Soils,” Annual Book of ASTM Standards, D422-63, Vol. 04.08.
- ASTM (2007), “Standard Test Methods for Determination of Water (Moisture) Content of Soil by Direct Heating,” Annual Book of ASTM Standards, D4959-07, Vol. 04.08.
- ASTM (2012), “Standard Test Method for Measurement of Suspended Sediment Removal Efficiency of Hydrodynamic Stormwater Separators and Underground Settling Devices,” Annual Book of ASTM Standards, C1746-12, Vol. 04.05.
- ASME (1971), “Fluid Meters Their Theory and Application — Sixth Edition.”
- NJDEP (2013), “Laboratory Protocol to Assess Total Suspended Solids Removal by a Hydrodynamic Sedimentation Manufactured Treatment Device.”
About The Author
 James Mailloux, senior engineer at Alden Research Laboratory, has over 25 years of experience in hydraulic engineering with a focus on physical hydraulic modeling and testing of stormwater Manufactured Treatment Devices (MTDs). Mailloux has served on multiple stormwater technical committees, designing and executing testing protocols and standards for multiple agencies, as well as ASTM International.