Mapping With Molybdenum: Using Sediment Characteristics To Understand Hypoxia In Estuaries
By U.S. EPA

In many estuaries and coastal environments, low levels of dissolved oxygen — also known as hypoxia in water — pose a threat to habitats and local ecosystems. Hypoxia can lead to fish kills and algae overgrowth, causing extensive damage to the ecosystem, fisheries, and other businesses that rely on the coastal environment. Hypoxia has increased in recent decades due to changes in the environment and increased human effects, particularly with increased loading of nitrogen in the environment from wastewater and agricultural uses. Hypoxia events are typically linked to excess nitrogen, but the connection between the two has been difficult to determine due to the complexity of coastal environments. Many factors can affect dissolved oxygen concentrations and hypoxia can vary greatly over space and time. To better understand the link between hypoxia and nutrient inputs, EPA scientists are using a surprising method — measuring molybdenum in surface sediment as an indicator for hypoxia throughout the water above it.
Molybdenum is a trace metal and can be linked to the duration of hypoxia throughout the water in an estuary or embayment. The metal reacts with sulfide, a product of hypoxic conditions, and causes it to accumulate in sediment that has been in contact with low-oxygen bottom waters.
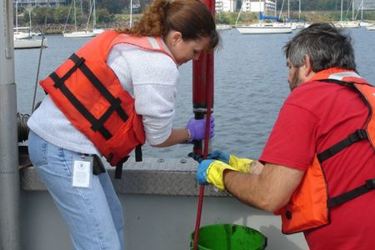
In a recent study, EPA researchers collected sediment samples from seven estuary and lagoon locations in Narragansett Bay, Rhode Island. They measured concentrations of authigenic molybdenum which is the fraction of molybdenum fixed in the sediment. To make the connection between molybdenum concentration and hypoxia, the scientists then converted the sediment molybdenum concentrations to the average annual duration of hypoxia in the water. They used a land use-based computer model to estimate the nitrogen loading to these locations from atmospheric, fertilizer, and wastewater sources. Next, estimated nitrogen loads at each location were normalized, which means they were divided by the volume of the embayment and multiplied by the time required for tides to flush a particle from the water body to account for dilution and flushing of the nitrogen.
“There’s no way to go back in time to take dissolved oxygen measurements,” EPA researcher Dr. Warren Boothman explained. “But we can go out and collect sediments, measure the molybdenum in them, and estimate when and how long the waters above those sediments have been hypoxic, depending on how deep a sample we collect.”
Using the normalized nitrogen loads and molybdenum concentrations in sediment, EPA researchers compared all the sample locations and found the highest molybdenum concentrations in locations that also had the highest normalized nitrogen loads. This indicates that areas with more nitrogen or long flushing times experience low oxygen conditions for longer periods than areas with lower nitrogen input or rapid flushing. Using statistics, they determined a threshold for nitrogen loading that would reduce the amount of ecologically damaging hypoxia events.
“Study results are often driven by few instances with very high values of the independent variable,” Boothman said. “To improve accuracy, we designed our sampling to ensure that our samples would be distributed evenly across the range of normalized loadings. This creates study results that are more reliable, which better shows the connection between molybdenum and hypoxia in Narragansett Bay.”
Sediment molybdenum could potentially become a reliable indicator of the extent of hypoxic events in coastal environments over time. By connecting the duration of hypoxia to nitrogen input, researchers can provide coastal managers and policy makers with data to develop standards and regulations to protect these important habitats.
Read more:
- Boothman, W.S. & L. Coiro. 2023. Mapping Hypoxia Response to Estuarine Nitrogen Loading Using Molybdenum in Sediments. Estuaries and Coasts. DOI: 10.1007/s12237-023-01215-9
- Boothman, W.S., L.S. Corio, S.B. Moran. 2022. Molybdenum accumulation in sediments: A quantitative indicator of hypoxic water conditions in Narragansett Bay, RI. Estuarine, Coastal and Shelf Science. DOI: 10.1016/j.ecss.2022.107778
- Sign up to receive email notifications for our new HABs, Hypoxia, and Nutrients Research Webinar Series
- Nutrients research at EPA
