
What State Hard Water Rankings Reveal About Utility Operations

By Kevin Westerling,
@KevinOnWater
Americans love rankings. Whether it's the best-tasting water, the cleanest beaches, or the most affordable places to live, we naturally want to know where we stand.
A newly released national water hardness database from TapWaterData does exactly that, ranking states and cities based on utility-reported hardness measurements. But while the "hardest" and "softest" water rankings are likely to attract attention, utilities may find the more important story lies beneath the numbers.
Water hardness is not regulated as a drinking water contaminant and is generally not considered a public health concern, yet it remains one of the most visible aspects of water quality for customers and one of the most misunderstood.
How Common Is Hard Water?
According to TapWaterData's analysis of more than 7,600 cities with measured hardness data, more than one-third of measured communities fall into the hard or very hard categories, while another third are classified as moderately hard. In other words, hardness is not an isolated regional issue — it is a characteristic of drinking water encountered by utilities and customers across much of the country.
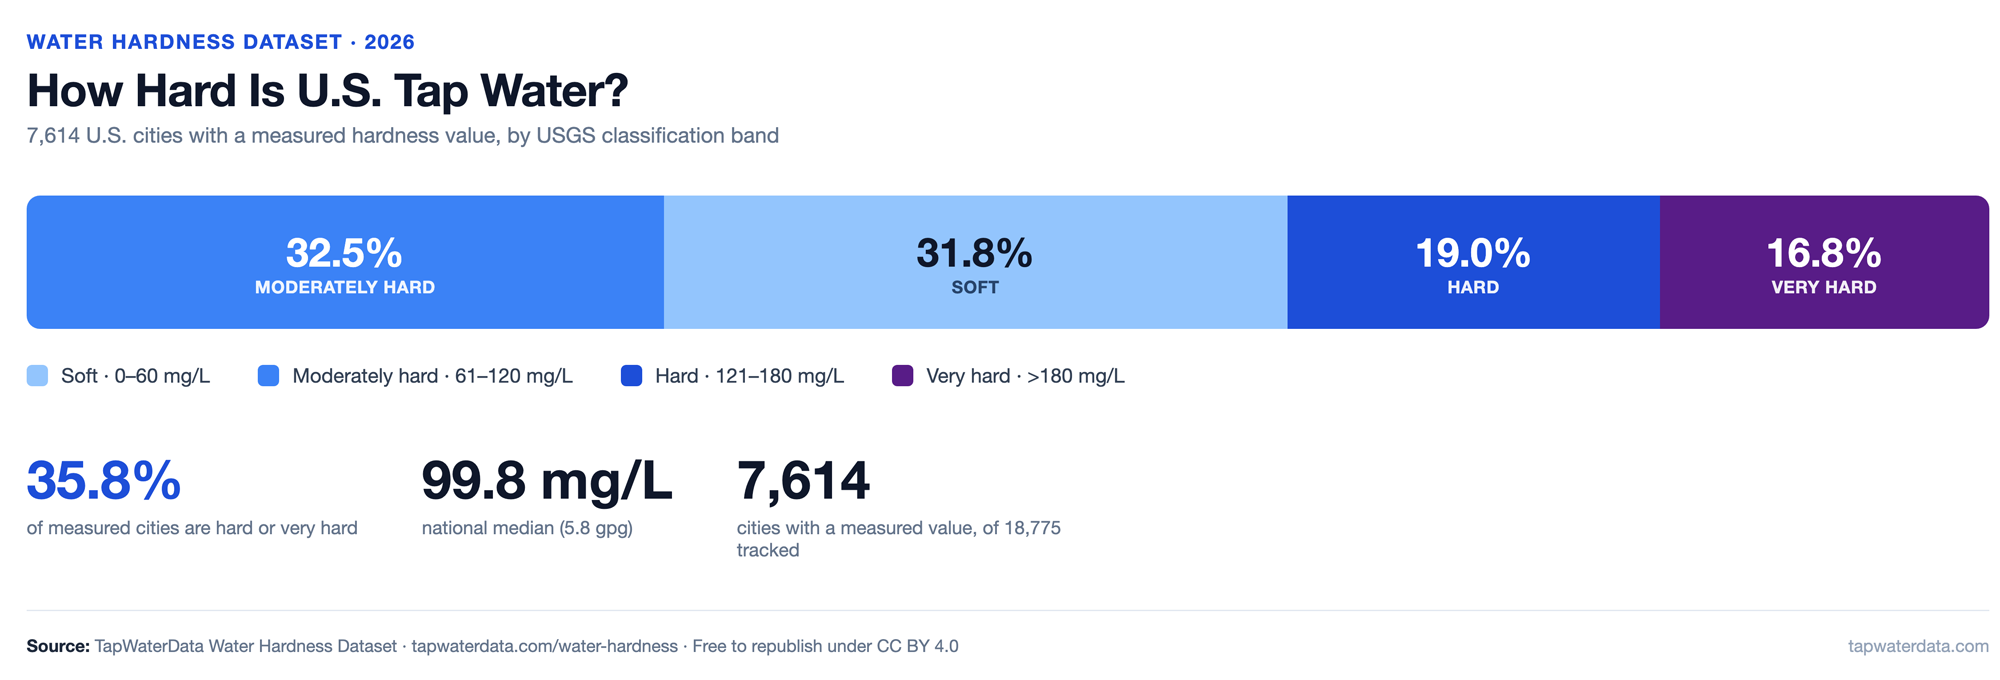
The dataset found that 35.8% of measured cities have hard or very hard water, while the national median hardness measures 99.8 mg/L as calcium carbonate, placing much of the country near the upper end of the moderately hard classification.
America's Hard Water Geography
Water hardness largely reflects local geology and source water characteristics. Areas drawing from groundwater sources rich in limestone, dolomite, and other mineral-bearing formations typically report harder water. Regions supplied by snowmelt-fed reservoirs, granite watersheds, or certain surface water sources often exhibit significantly lower hardness levels.
At the state level, the highest median hardness levels are concentrated in parts of the Midwest, Mountain West, and Southwest, led by Utah, Illinois, and Nebraska. Meanwhile, Maine, South Carolina, and Oregon report some of the softest water in the country.
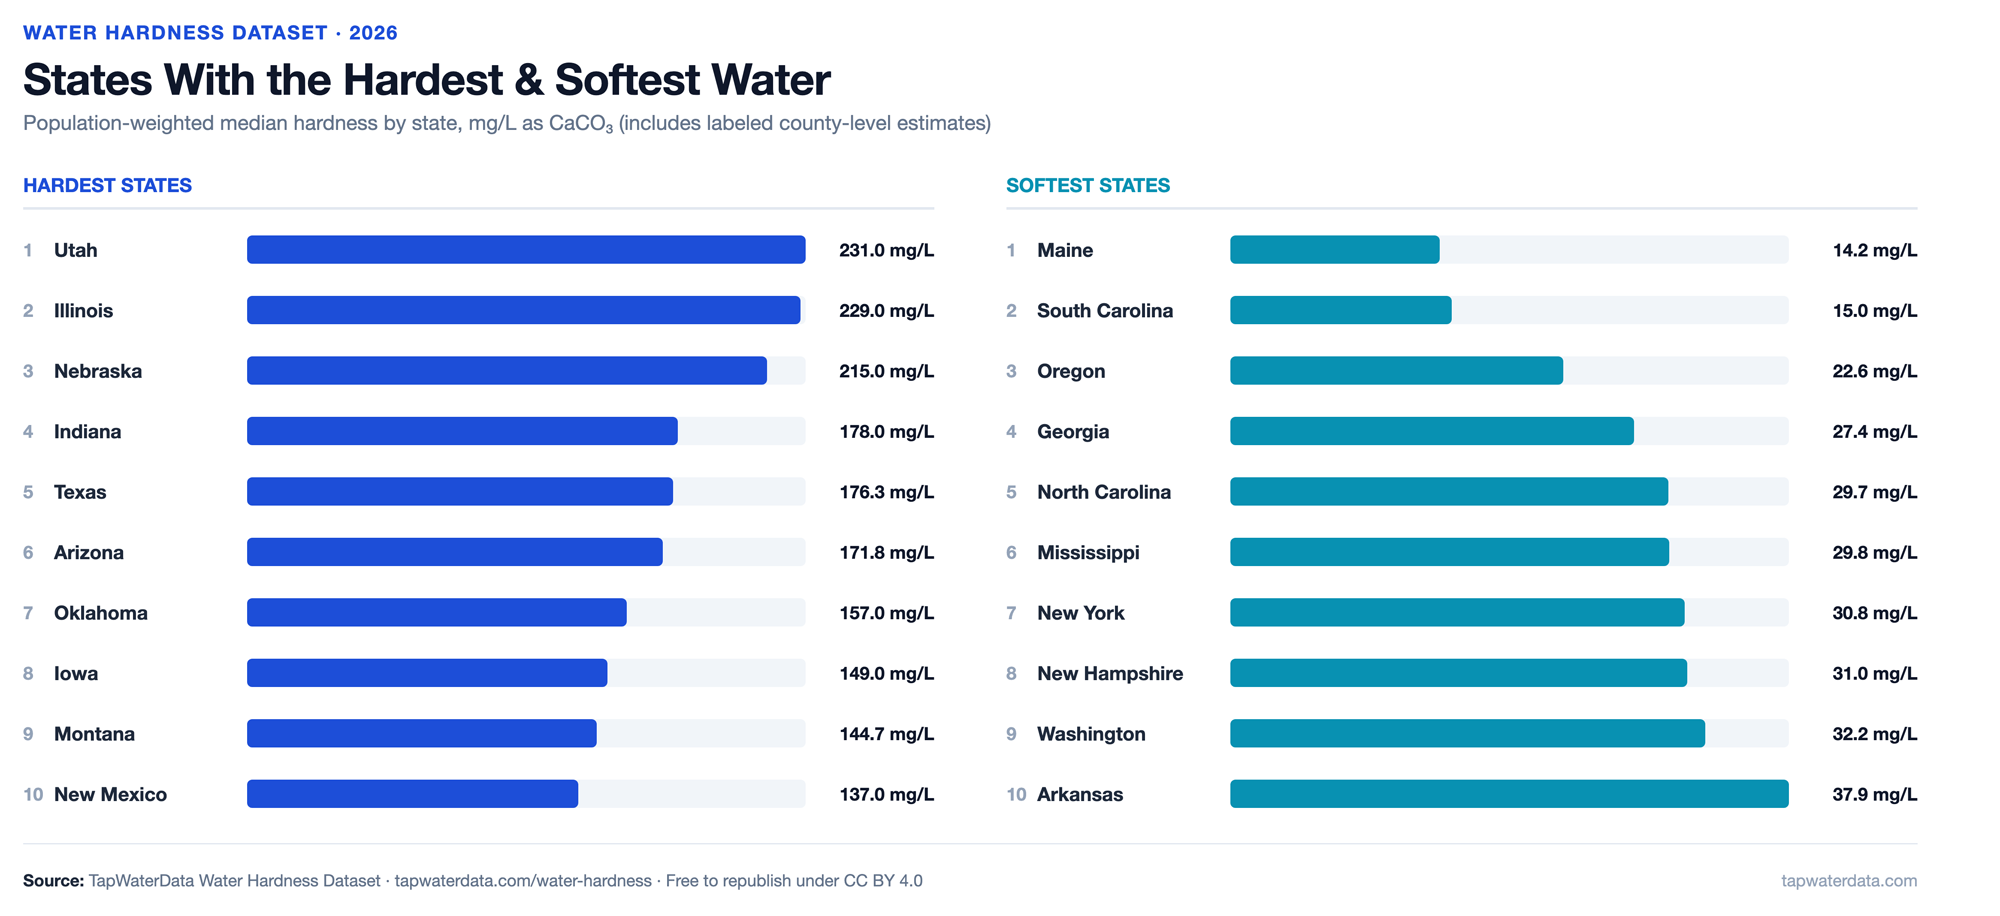
The distribution is far from random. Hardness tracks geology much more closely than geography.
That distinction can be dramatic, even between neighboring communities.
San Francisco's water, sourced largely from the Hetch Hetchy watershed, measures just 25.1 mg/L and is considered soft. Less than 40 miles away, San Jose's blended groundwater and imported supplies produce hardness levels of 184.6 mg/L, placing it firmly in the very hard category.
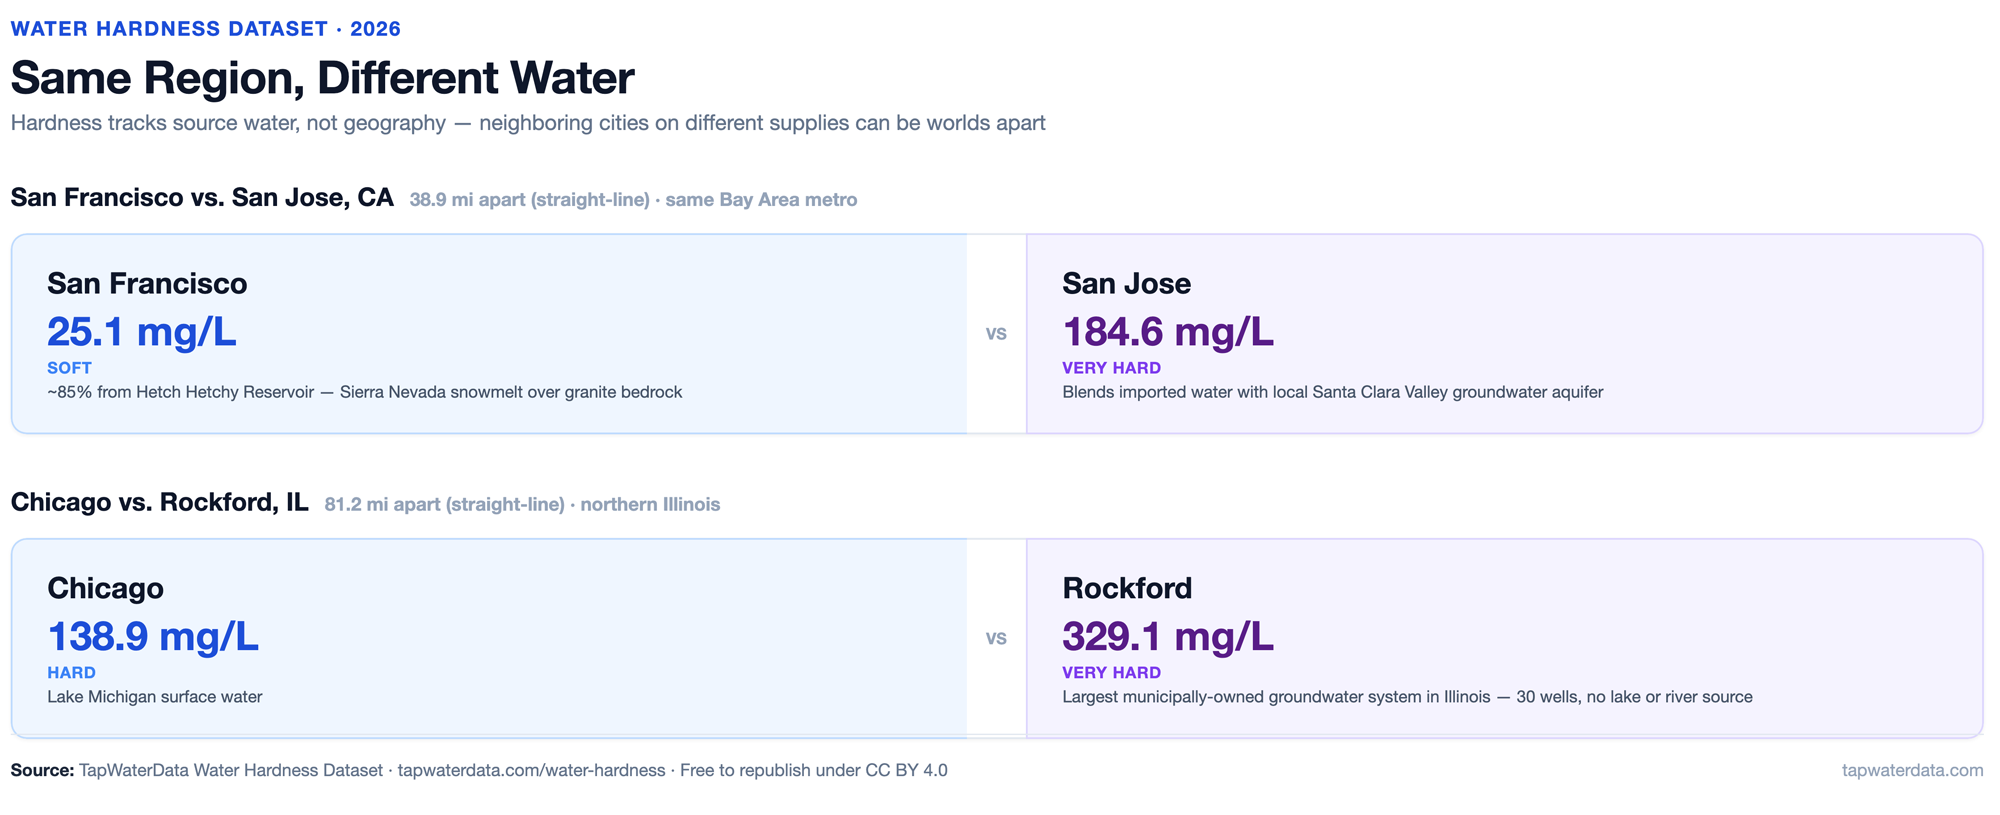
The takeaway: water hardness is often less a regional phenomenon than a reflection of where utilities obtain their source water.
Why Customers Care
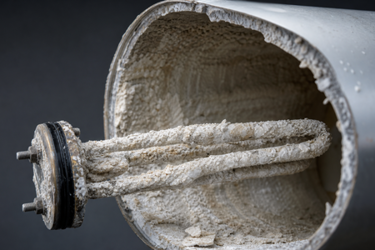
Although hardness does not trigger regulatory violations, customers encounter its effects daily through familiar nuisances such as white spotting on dishes and fixtures, reduced soap performance, scale buildup in faucets and showerheads, sediment in water heaters, and increased appliance maintenance.
As a result, utilities with hard water frequently find themselves fielding customer inquiries about water quality despite delivering water that fully meets all drinking water standards.
“Hardness is the one water-quality issue every household eventually notices,” says Andy Zhang, founder of TapWaterData. “It doesn't fail a health standard, so it gets treated like a footnote, but scale is quietly running up energy bills and shortening the life of equipment throughout the home.”
Research cited by TapWaterData suggests scale buildup can reduce water-heater efficiency, increase energy consumption, and shorten appliance lifespan, creating costs borne largely by consumers rather than utilities.
That dynamic creates a unique communications challenge. Customers often equate visible impacts with water quality problems, even when the issue is aesthetic or operational rather than health-related.
Hard Water Creates Scale, Not Corrosion
Ask many consumers about hard water, and they'll likely tell you it damages pipes.
Not exactly.
In fact, the relationship between hardness and infrastructure is considerably more nuanced.
Hard water creates scale. It does not necessarily create corrosion.
Those are two very different challenges.
Scale deposits can restrict flow, reduce heat-transfer efficiency, and complicate equipment maintenance. However, calcium carbonate deposits can also form protective layers on metal surfaces.
By contrast, some of the greatest corrosion risks occur in softer, lower-mineral waters.
This distinction is particularly relevant as utilities continue preparing for Lead and Copper Rule Improvements (LCRI) compliance. Corrosion-control programs focus primarily on factors such as pH, alkalinity, and inhibitor treatment, not hardness itself.
Utilities may operate systems with relatively hard water and strong corrosion control or systems with soft water that require extensive corrosion-management strategies.
The lesson is that hardness and corrosivity are not interchangeable concepts.
When Solving One Problem Creates Another
For some customers, the response to hard water is to install a water softener.
For utilities, however, widespread residential softening can introduce downstream challenges.
Softener regeneration cycles discharge concentrated salt brines into wastewater systems, contributing chloride loads that conventional treatment processes struggle to remove economically.
In some regions, utilities have found themselves navigating a balancing act between customer demand for softer water and growing concerns over chloride discharges to receiving waters.
As a result, some agencies have explored alternative approaches, including high-efficiency softener incentives, public education efforts, and centralized softening programs.
The issue underscores an increasingly common reality in water management: solutions in one part of the water cycle can create unintended consequences elsewhere.
Beyond The Rankings
The rankings may draw attention, but the real value of the TapWaterData project extends beyond state-by-state comparisons. The underlying dataset provides useful context for understanding how hardness affects customer experience, treatment decisions, and infrastructure performance.
For utilities, the larger takeaway is that water hardness sits at the intersection of customer perception, asset performance, treatment strategy, corrosion control, and wastewater management.
Unlike many water-quality parameters, hardness is something customers can see.
And when customers can see it, they ask questions.
Utilities that understand the operational implications of hardness, communicate those implications clearly, and distinguish hardness from genuine health or compliance concerns may be better positioned to manage both customer expectations and long-term infrastructure decisions.
In that sense, hardness may not be a regulatory issue, but it remains very much a utility issue.