
Effective Sludge Mixing Through Distributive Mixing Principles
By Sami Sarrouh
Computational fluid dynamics (CFD) modeling helps wastewater operators derive a formula for highly effective and cost-efficient sludge mixing.
ixing sludge is more complex than mixing other fluids because of its non-Newtonian characteristics. Some manufacturers provide mixing systems for sludge in holding tanks and digesters with varying degrees of success. In order to properly design such systems, it is important to understand the physical characteristics of the fluid and its response to applied forces. Sludge behaves differently at different solids content. To simplify the discussion, we shall categorize sludge solids content, or total solids (TS), from a fluid dynamic aspect according to the following:
- TS ≤ 2 percent — Low content where sludge behavior is not much different from water.
- 2 < TS < 4 percent — Average content where sludge behaves as a non-Newtonian fluid, but not drastically different from water.
- 4 ≤ TS < 8 percent — High content where the solids start to behave as pseudo-plastic fluid. Here the ratio of volatile solids (VS) content to TS becomes a major factor.
- 8 ≤ TS < 12 percent — Sludge is pretty much a semisolid and not achievable without some form of thickening.
- TS ≥ 12 percent — Sludge is dewatered and handled as a solid.
Some sludge may include sand particles. Sand is abrasive and can cause much faster equipment wear, but the solids content required to change flow characteristics is higher than treatment sludge and dependent on particle size. Literature shows that sand slurry exhibits shear-thinning, non-Newtonian behavior for all solids concentrations at low shear rates. However, at higher shear rates, high concentration sand solids suspensions transition from a shear thinning to a shear thickening. Such high shear rates may be present in a pump, for example; therefore, sludge “behavior” may vary considerably with sand content. Accordingly, mixing system design has to accommodate variable conditions and assist in removing potential blockages caused by unforeseen conditions.
Mixing efficiency is determined by the behavior of the fluid interfaces, and knowledge of the dynamics of the interfaces is crucial. The volume enclosed by the outer interfaces between recirculated or influent and ambient sludge, rather than the interfacial surface area between the different sludge, is what determines mixing efficiency. Large-scale dynamics of the outer interface provide the dominant contributions to the mixing efficiency.
The mixer design presented in this article utilizes a combination of dispersive and distributive mixing. The latter, also known as macromixing, relies on swirl created by directed flow that causes laminar thinning of the interfaces, thereby increasing volumetric combination of the sludge. A repeated cutting-and-folding action of the mixture also increases the distribution of different sludge components. The effectiveness of a mixer in distributive mixing is a function of how the influent jets interact with the ambient sludge in a geometric sense. That is, the volume enclosed by the outer interfaces rather than the interfacial surface area is what determines mixing efficiency.
Conversely, the effectiveness of dispersive mixing (micromixing) is dependent on the system’s jets’ shearing interaction with the sludge. During episodes of high sand influent concentrations, it may be detrimental to have high shear rates because it increases sand particle interactions, making the sludge behave in more of a shearthickening manner. At an influent concentration of 6 percent or less, the sand is not to be considered of sufficient high concentration to cause the shift from shear thinning to thickening. In this case, the sand has a much higher settling velocity and may accumulate faster at the tank’s conical bottom, increasing the concentration there and possibly causing a characteristic change in the recirculation pump suction. The mixing system has to account for sand concentration increasing in the settled sludge at the bottom. In addition, the uniformity of the stress distribution determines the uniformity of the mixing. Without uniform distribution of the shear stresses, it is impossible to guarantee that the same level of mixing is applied to all parts of the tank. Hence, a small number of jet nozzles may not be sufficient to entrain the entire volume of the tank. Turbulence in the region close to the inlet nozzle results in micromixing that cannot be maintained as the flow gets farther from the source in a high-viscosity ambient fluid. Research infers that high jet velocity inlet sources will always revert back to macromixing as the flow gets farther from the source. Thus, the energy cost required to expand micromixing to cover an entire tank would be excessive.
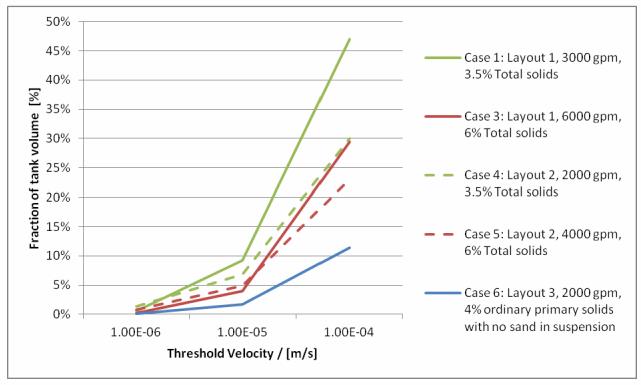
Figure 2. Velocity distribution chart for Design Layouts 1, 2, and 3
In this case study, solids rheology did not exist for the sludge discharged in the holding tank, but volatile solids were known to be less than 80 percent. Therefore, it was less likely that 4 percent solids would behave as a semisolid and more likely that they would behave as a liquid, making the solids more flowable into the pump suction. In general, CFD results typically suggest a reduced solids settling potential, solely due to calculated high viscosities. If the actual viscosities were different, settling may occur. In addition, there is a difference between water and various wastewater sludge characteristics and settleability. Real-world experience suggests that sludge solids in the design range do settle with time, such as in gravity thickeners, hence the need for mixing systems. Therefore, it is recommended not to base non-Newtonian curvilinear flow conclusions solely on a noncalibrated CFD model utilizing empirical viscosity values. For CFD to be cost-effective, it is best used for comparative performance analysis of design alternatives. Based on the author’s experience, it is strongly recommended to utilize a conservative design approach rather than optimize it based on the CFD’s results.
A CFD model can provide simulated data needed to optimize a design. The objective of the CFD modeling in this effort was to compare different design layouts rather than to achieve quantitative results. The multiphase flow in a sludge holding tank was modeled using the Euler-Euler multiphase model. Turbulence effects were ignored as the apparent viscosity of the fluid was expected to be high, and therefore, the turbulent regions were expected to be limited to a small volume of fluid near the design’s nozzle jets. Therefore, in this case, laminar viscosity effects were expected to be more important than turbulence effects in the majority of the tank volume. Furthermore, the available turbulence models were not validated for use with non-Newtonian fluids. The secondary phase (sand) was modeled as a granular phase including drag force effects on sand particles. Tracking sand distribution was used as a means for evaluating mixing performance. Cohesive sediments were not accounted for in the model. Settled sand was assumed to leave the tank through the bottom outlet.
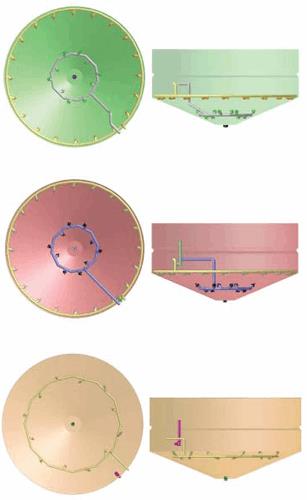
As shown in Figure 1, three different mixing design configurations were designed by the author and modeled by Naveen Gopinathrao for a 60-ft-diameter sludge tank with 32-ft water depth at center. Design Layouts 1 and 2 are very similar, with the difference being the inner loop’s outward nozzles’ direction was reversed in Design Layout 2. Design Layout 3 replaces the two nozzle loops with one intermediate one. Micromixing using high-velocity agitation requires a considerable amount of energy due to the high-viscosity sludge. Therefore, the design attempts to achieve macromixing of the sludge by distributing the flow in a three-dimensional manner and making use of density currents. Some nozzles push the heavy solids towards the bottom suction where it is combined with lowerdensity stream lines from the surface. Other nozzles redistribute the sludge to higher regions of the tank.
The mixing system Design Layouts 1 and 2 maximize the effect of density currents that direct the heavier solids towards the suction pipe at the bottom of the cone. The suction inlet is oriented upwards to allow streamlines of lower-density solids originating near the water surface to reach the bottom where it joins the higher-density solids sliding along the conical surface. High-density solids flow by gravity along the sloped bottom towards the recirculation suction pipe aided by momentum imparted by the upper loop nozzles. The nozzles are distributed along the upper cone’s perimeter and angled parallel to the conical bottom surface to create boundary layer attachment at the surface of the cone. The nozzles on this upper loop are angled from radial direction. The lower pipe loop is located at about a third of the tank radius. This is the location where all the upper loop’s jet paths will intersect. The lower loop has nozzles that are sized to provide the same total flow as the upper loop, although it has fewer nozzles. The lower loop’s nozzles are located such that six nozzles are angled up and offset a few degrees from radial, while four nozzles are angled down and offset from radial to continue the solids motion towards the suction pipe.
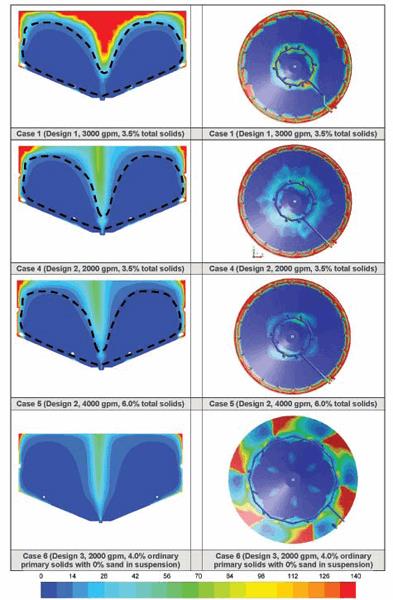
The findings show that the mixing system results in a tank with little potential for major sand/solids accumulation. However, it shows that out of the three design layouts modeled, Design Layout 2 with lower recirculating flow rates provides the best mixing with the lowest operational risk and the best ability to recover from unforeseen conditions.
Contour plots of velocity magnitude indicate zones of effective fluid agitation as well as zones of stagnation. Nevertheless, in thick sludge all velocities in the tank are very low due to very high apparent viscosity of the sludge that quickly dissipates the jets’ momentum. The velocity distribution in the tank is presented as a chart in Figure 2, which shows the percentage volume of tank where the fluid velocity is less than a defined threshold (1e-6, 1e-5, and 1e-4 m/s in this case). For Case 1 (Design Layout 1 at 3000 gpm), it can be seen that the fluid velocity is less than 1e-4 m/s in nearly 50 percent of the tank volume. The comparison between Cases 1 and 4 versus Cases 3 and 5 shows that Design Layout 2 achieves a better mixing than Design Layout 1, as the volume where the velocity is below 1e-4 m/s is smaller for Design Layout 2 (Cases 4 and 5), although the flow rates for Cases 4 and 5 were two-thirds those of Cases 1 and 3.
Another method used to compare design efficacy involves calculating sludge residence time at various regions within the tank. In a direct comparison between Design Layouts 1 and 2 from the CFD analysis, the potential for sand accumulation in Design Layout 2 is decreased due to lower and better distribution of residence time, although the recirculation flow rate and associated energy is reduced by two-thirds. Thus, a simple reorientation of the nozzles had a significant impact. The better flow distribution resulted in a better residence time distribution — or, in other words, less short-circuiting at various tank regions. In addition, Design Layout 2 performance is such that increasing sludge solids content from 3.5 percent to 6 percent required an increase from 2,000 to 4,000 gpm to maintain relatively similar performance. This indicates that using the 3,000/6,000 gpm flow rates with Design Layout 2 provides the resiliency to help recover from unforeseen operating conditions.
The mixing system design philosophy described in this article has been used successfully in both an alum sludge holding tank application and a wastewater sludge holding tank. The results indicate that proper sludge distributive mixing can reduce recirculation pumping costs by approximately 50 percent while achieving better performance.
About The Author
 Sami Sarrouh, PE, is vice president and senior technical environmental engineer at T&M Associates. He has over 28 years’ experience in applied research, design, and management, working on about 200 different projects in the water and wastewater industry.