
Average Household Utility Costs Rise 41% In Last Five Years
Utilities Intelligence Report
Quarterly Share of Wallet Tracker: Residential Electric, Gas and Water
Q2 2025
Average Household Utility Costs Rise 41% in Last Five Years
As part of its ongoing analysis of customer experience with residential utilities, J.D. Power tracks the average prices customers pay for electric, gas and water services nationwide. This average price data is tracked in four waves over the course of the year, which are roughly in line with calendar quarters. The following are key highlights from the Q2 2025 analysis.
Key Findings
Average Monthly Household Utility Costs Up 41% Since Q2 2020
The average amount paid for residential electric ($184.00), gas ($141.00) and water ($99.00) is $424.00 through the second quarter of 2025. That’s an increase of 5% ($19) since Q1 2025 and an increase of 41% ($122.43) since the second quarter of 2020 in total residential utility costs.
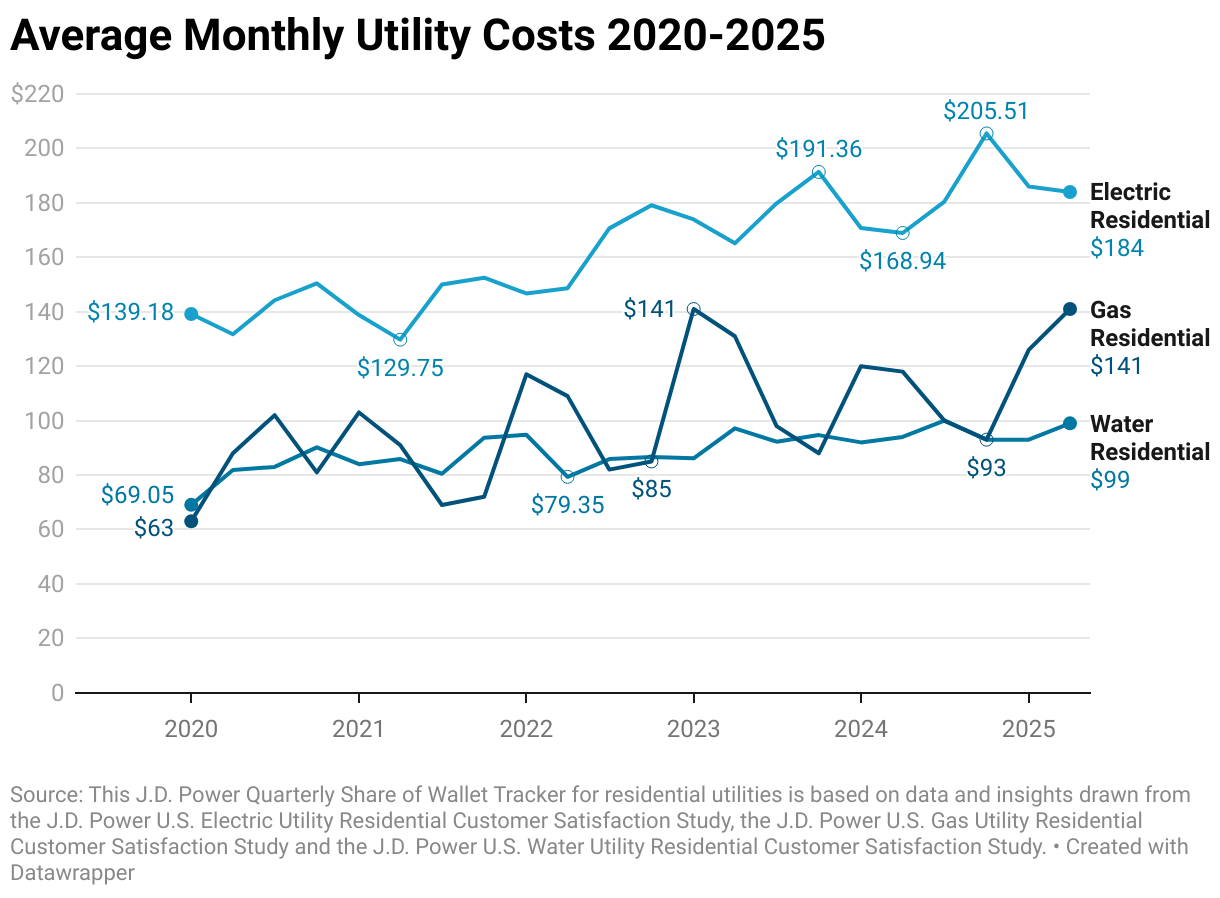
Gas Prices Up 60% in Five Years
The average amount paid for a monthly residential gas utility bill is $141.00 through Q2 2025. That is $15.00 per month more than the average price paid in Q1 2025, and $53.00 more than Q2 2020 figures, a 60% increase over the past five years.

Total Share of Wallet
Monthly utility bills have come to occupy a significant share of consumers’ recurring household expenses. Based on a median annual household income of $80,610[1], monthly electric, gas and water bills now account for 6.3% of utility customers’ household income, up from 4.5% in Q2 2020.
Any incremental movements on a quarterly or annualized basis can have a material effect on not only customers’ overall satisfaction with their utility providers, but also their purchasing power. While most residential utility customers are now seeing declines from some of the sharpest increases in utility bills experienced during 2023, the longer-term trend in price increases shows just how significant a portion of monthly consumer outlay utilities have come to represent.
Methodology
This J.D. Quarterly Share of Wallet Tracker for residential utilities is based on data and insights drawn from the J.D. Power U.S. Electric Utility Residential Customer Satisfaction Study, the J.D. Power U.S. Gas Utility Residential Customer Satisfaction Study and the J.D. Power U.S. Water Utility Residential Customer Satisfaction Study.
[1] United States Census Bureau https://www.census.gov/library/publications/2024/demo/p60-282.html
Source: J.D. Power