
SWAN Corner: Wastewater Components Guide Sewer Investigations
By Julia Kariniemi

Extraneous water in the wastewater network is likely to increase as the climate change progresses. Wastewater components can offer key information for water utilities for prioritizing network inspections and renovations, such as CCTV and manhole cover inspections. At the same time, calculating wastewater components out of pumping stations data is a valuable example of how water utilities can extract concrete insights from large data sets.
Sewer networks in the Nordics are vulnerable to inflow and infiltration (I&I), which consists of extraneous water from different sources, such as rainfall, water distribution network leakages, and groundwater infiltration. For example, a 2018 estimate states that the portion of I&I of total wastewater amount in the Finnish water utilities varied between 34.5 to 45.6 percent (Vesilaitosyhdistys, 2018). With the amount of stormwater from rain events likely to grow as the climate change progresses, water utilities aim to find new ways to manage the issue.
In early 2021, Neuroflux started developing ways to calculate wastewater components for specific catchment areas in a project with HS-vesi water utility in Finland. Typical components of sewer water include groundwater infiltration (GWI), base wastewater flow (BWF), and rainfall derived inflow and infiltration (RDII). Ideally, wastewater would mostly consist of BWF, i.e., wastewater from households, public facilities, companies, industry, etc. In large amounts, the other components increase the risks for overflows and system failures as well as extra use of resources, such as energy and chemicals during the treatment processes.
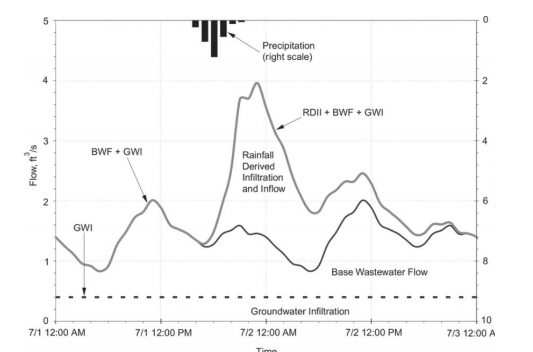
Figure 1. Typical wastewater hydrograph (Walski et al., 2007)
Wastewater Components Help Water Utilities Allocate Their Resources For Network Investigations And Renovations
The main benefit from knowing the wastewater flow components for specific areas is the ability to roughly determine the primary entry point of extraneous water for the area. With high amounts of groundwater infiltration, the entry points are likely to include defective pipes or leaking manhole walls or pipes, for example. A large amount of rainfall derived inflow may point to water entering through defective manhole covers, cross connections from storm and combined sewers as well as leaking flap gates, to name a few. Provided with an analysis for each area, a water utility may narrow down which areas would benefit the most from CCTV inspections or other types of investigations.
The calculations for the wastewater components were completed using pumping station data, such as flow and pump runtimes. During the project, we also found it valuable to begin with checking the quality of the data by comparing the pumping stations’ flow measurements to the energy consumption in different conditions. This way, we were able to ensure highly reliable results from the final analysis. It is also worth mentioning that accuracy by the cubic meter is not mandatory for this method: the proportions and changes in the water flow components are sufficient.
Finally, the calculations were applied to the entire network consisting of over 300 pumping stations, providing HS-vesi with a breakdown of wastewater components for each catchment area in their network. Complicated modelling work is not required, because the calculations are based on pumping station data only, which makes it possible to easily implement the process on larger networks as well.
HS-vesi Prioritizes Network Inspections With Wastewater Flow Components
HS-vesi has already undertaken ambitious plans to carry out condition assessments for the entire network, categorizing pipe sections based on their renovation needs. So far, any network investigations have been prioritized by the known condition or reported number of problems in the area. The wastewater component calculations are now also integrated to be a part of the predictive maintenance, condition assessment, and renovation processes, with the main goal being identifying the characteristics of each area in order to select the most effective measures.
One of their approaches has been to examine a time period with no rain and look for areas that still continue to present a high amount of GWI: these areas are then prioritized for CCTV inspections. Another way to look at the components has been analyzing the results after a significant rain event, because the areas with a high proportion of RDII would likely benefit the most from manhole cover and flap gate inspections, for example. With consistent improvements in the network, the results are intended to show in the utility’s key figures that mark their progress, such as inflow and infiltration percentage and others.
References
Vesilaitosyhdistys (2018). Vesihuoltolaitosten tunnuslukujärjestelmän raportti 2018. Retrieved on 17 December 2020, from https://www.vvy.fi/site/assets/files/3034/tunnuslukuraportti_2018.pdf.
Walski, T. M., Barnard, T. E. Harold, E., Merritt, L. B. Walker, N. & Whitman, B. E. (2007). Wastewater Collection System Modeling and Design. Bentley Institute Press.
Julia Kariniemi is a Client Relationship Manager at Neuroflux, which combines the best practices of software development and design with water engineering to create comprehensive and intuitive solutions.
SWAN, the Smart Water Networks Forum (SWAN), is the leading global hub for the smart water sector. A UK-based non-profit, SWAN brings together leading international water utilities, solution providers, academics, investors, regulators, and other industry experts to accelerate the awareness and adoption of “smart,” data-driven solutions in water and wastewater networks worldwide. Learn more at www.swan-forum.com