
Optimizing RO-Membrane Performance In Produced-Water Applications

The makeup of produced water generated from oil, natural gas, or coal-seam-gas (CSG) production and other sources creates many challenges for water reuse or discharge to the environment. Reverse osmosis (RO) membranes are essential to treatment, but not all industrial applications warrant identical approaches.
Whether an RO membrane decision-maker works for an organization generating produced water or for an RO service contractor treating it, the challenges of maintaining manageable levels in produced water retention ponds are the same. Here are key factors that should be considered for their influences on produced water chemistry, treatment strategies, the ultimate cost of treatment, and the ability to derive maximum value from reused water at minimal total lifecycle costs.
The Challenges Of Produced Water
Treating produced water generated by oil drilling, gas drilling, or industrial mining is more difficult than typical seawater desalination in that it is typically laden with a host of components that cannot simply be discharged back into the environment. It must be treated to acceptable levels for discharge or for reuse in the original production processes, in irrigation or aquifer recharge, or for other uses. For example, produced water reused in agricultural irrigation needs to maintain boron content below 1 mg/L to prevent it from killing irrigated plants. The delicate balance of treatment hinges on a variety of logistical and financial challenges, including:
- the composition of the produced water itself, in terms of contaminant type and load concentration,
- regulatory requirements for the intended discharge or reuse application,
- the types of RO membranes used for treatment (Figure 1),
- energy costs associated with RO performance,
- membrane cleaning and maintenance practices,
- the cost of shipping/treating concentrated brine remaining after RO, and even
- the scarcity of water at remote operating sites.
For well or mine operators and their water treatment services, this article addresses such issues from the perspectives of treatment efficacy and cost efficiency as well as other contractual factors relating to treatment and discharge.
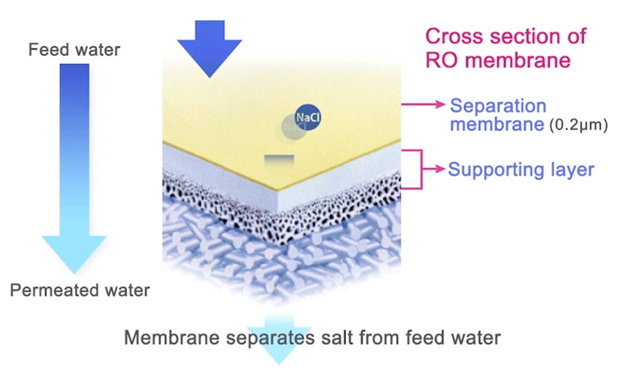
Graphic courtesy of Toray Industries, Inc.
Figure 1. Reverse osmosis (RO) membranes with extremely fine pore sizes stop salts (NaCl) and other contaminants from passing through the membrane with the clean permeate. Multiple filtration stages can concentrate the residual brine to less than 10 percent of the original feedwater volume to minimize shipping and/or treatment costs.
Membrane Performance Considerations
One of produced water’s biggest challenges is the fact that its composition can easily change from application to application, from location to location, and even within a single location based on variables of seasonality or production volume.
Because of this variability, it is not practical to compare membrane products by manufacturer spec sheet “equivalence,” laboratory-condition QC ratings, or purchase cost alone. The only quantitative method to compare the relative cost effectiveness of membrane options is to run them side by side in the real-world application to measure performance and longevity under the produced water’s unique chemical composition and load fluctuations.
With that in mind, here are some preliminary issues to consider when evaluating existing produced water RO performance and optimizing cost efficiency for future operations:
- Pretreatment. The initial step in optimizing produced water treatment is not the RO system itself. It is the pretreatment system that prepares feedwater so that RO elements can deliver the most favorable and stable performance. Ultrafiltration (UF) removes suspended materials that act as foulants and ion exchange (IE) removes heavy metals that can oxidize RO membrane surfaces when they react with monochloramines used for biofouling control.
- Permeate Quality. When evaluating produced water treatment success, the essential question is whether the permeate quality meets expectations. Not all membranes are designed the same, nor do they perform the same in produced water applications as they do in brackish water or seawater applications. Making appropriate choices and balancing cleaning maintenance and membrane replacement according to performance monitoring (Figure 2) (instead of waiting until the point of failure) can extend performance life and optimize the balance between capital expenses (CAPEX) and operating expenses (OPEX).
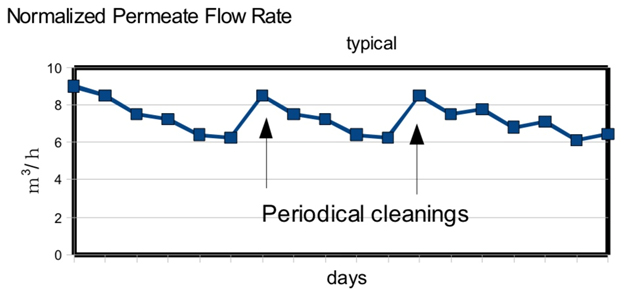
Graphic courtesy of Toray Industries, Inc.
Figure 2. Monitoring the dropoff in permeate flow rate (normalized to account for variable temperature and pH conditions) indicates when periodic cleanings are appropriate. The objective is to maintain maximum throughput efficiency with minimal membrane cleaning or replacement disruptions. All-too-frequent cleanings can indicate problems ranging from poor pretreatment design to membrane quality or aging issues.
- Productivity Cost Implications. Whether membrane acquisition costs are the responsibility of the well/mine operator or the RO treatment provider, both the membrane chosen and the way it is maintained can impact all parties involved. The true cost of handling produced water depends not only on membrane cost but also on the cumulative costs, inconveniences, and risks involved in failing to achieve regulatory compliance or generate water reuse income or savings. That is why it is important to evaluate membrane performance on the total associated costs that get magnified as the size of an application grows.
- Energy Costs. As RO membranes foul or lose efficiency, they can require longer cycle times and more energy to achieve the desired throughput, elevating operating costs to a point where a maintenance cleaning or membrane replacement is warranted.
- Material And Maintenance Costs. RO membrane costs can vary by performance grades required for the severity of the applications. Choosing an inappropriate low-cost membrane to save on CAPEX can impact permeate quality or result in much higher OPEX maintenance costs. Premature fouling can also run up cleaning and replacement cost and effort, even if it is not a membrane issue alone. It could indicate a need for better pretreatment to remove as many foulants as possible before they reach the RO membranes.
- Overlooked Costs. Aside from direct costs for membrane purchases and associated labor/operating costs, it is also important to account for hidden costs in the process (e.g., excessive maintenance downtime, lost productivity, shipping costs for offsite brine treatment, etc.). Poor upfront contaminant removal and poor membrane performance can exacerbate these costs.
- Membrane Longevity. Beyond lost productivity costs associated with cleaning frequency, the physical impacts of repetitive cleaning can also shorten effective membrane life, resulting in more frequent replacement purchases.
- Brine Handling Demands. Better membrane performance can reduce the volume of residual brine that needs to be treated after RO treatment, saving both treatment and transportation costs that can be magnified in remote operations.
- Seasonal Considerations. Summertime fouling due to increased biological growth can impact performance, multiply maintenance requirements, and raise the cost of maximizing RO performance.
Practical Guidelines For Optimum Performance Efficiency
Although it is difficult to predict long-term membrane performance accurately, it is reasonable to reference general industry experience to determine when produced water RO treatment systems are performing far below expectations. Monitoring the makeup of both raw produced water entering the RO process and treated effluent leaving it provides helpful data for identifying abnormal performance. Daily readings should be normalized to account for variations in salinity, in order to quantify the true indication of declining performance.
- Rules Of Thumb For Performance And Replacement. In produced water applications, look for a minimum of six months between service intervals, with an expected membrane life of three to five years, depending on the harshness of the feedwater. Membranes should typically last from six to 10 cleanings, based on the aggressiveness of the feedwater and the permeate quality required.
Testing competitive membranes side by side in the same process and monitoring the permeate quality and quantity for each version will also provide a true picture of real-word performance and value. This is more accurate than making hypothetical comparisons of spec sheet QC parameters based on less-aggressive water compositions.
- Cleaning/Maintenance Schedules. Cleaning should be performed whenever normalized permeate flow rates decrease by more than 10 percent, or when differential pressure or normalized salt passage increases by more than 20 percent. For optimum performance and longevity, follow manufacturer recommendations for operation monitoring, flushing, and cleaning protocols.
- Chemical Wash vs. Aggressive Cleaning. At early signs of reduced RO permeate flow, perform a gentle chemical wash with an appropriate chemical for the fouling problem — acidic cleaning for metal hydroxides and alkaline agents or detergents for organic or biological fouling. Repeat if necessary. Doing so can be less disruptive to process operations than aggressive full-scale cleaning and can typically restore normal operating condition without risk of shortening membrane life.
- Full Membrane Replacement. RO membrane performance naturally decreases over time, based on contaminant loads in produced water and on cleaning frequency. Monitoring performance changes on a monthly basis (see below) makes it easier to determine membrane failure or when the cost of performance and frequency of maintenance warrant membrane replacement.
Optimal Strategies For Lowering Total Lifecycle Cost
Establishing good protocols for measuring permeate quality and quantity will provide better guidelines for profitable operating decisions and lowest total cost of operation.
- Regular Monitoring. Performing full water analyses on both changes in feedwater makeup entering the RO system and the quality of permeate coming out of each bank of an RO system enables treatment system operators to make timely decisions about optimal system operation and maintenance. Tracking runtime and output volume can highlight small inefficiencies that drive up energy costs and lead to more frequent maintenance.
- An Ounce Of Prevention. Where high concentrations of salts or components foul membranes, pretreatment steps such as UF and IE can reduce the excess load in the feedwater before it reaches the RO membranes. This contributes to longer membrane life and promotes cost-effective overall performance in terms of membrane costs, minimized downtime, and reduced labor costs.
- Balancing Operating Costs. Tracking maintenance trends makes it easier to strike an ideal balance between maintenance downtime costs and membrane replacement costs. One way to spread the total costs of RO operations more evenly from year to year is to replace a smaller percentage of RO elements at each cleaning instead of waiting for a catastrophic failure or replacing all elements at one time. It usually makes sense to replace the highest-loading RO elements in the treatment train first and continue in order of priority until all elements are replaced. Well-paced service intervals on just one RO bank at a time also enable each service event to be of shorter duration (a day or two) and easier to accommodate within normal production schedules than one major overhaul event lasting weeks or months.
Proof In Performance
One example of successful RO treatment for produced water is a CSG operation in a water-challenged environment of Queensland, Australia. There, high organics, suspended solids, and TDS ranging as high as 8,000 mg/L risk fouling RO membranes, while boron and fluoride challenge regulatory-compliance and water reuse concerns.
Two-stage pretreatment and a three-stage 26-MGD treatment system using low-fouling, high-tolerance, cross-linked polyamide-composite RO membranes protect precious groundwater resources and prevent contamination of soil and shallow aquifers around the facility (Figure 3). The system recovers more than 90 percent of produced water flow for reuse in irrigation applications, with its high-quality permeate exhibiting low levels of boron (<1 mg/L), fluoride (<0.5 mg/L), and TDS (<175 mg/L).
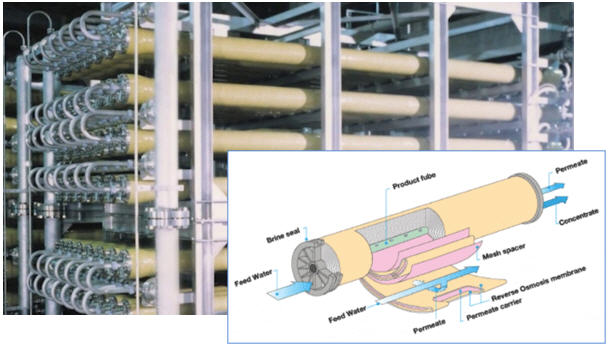
Photo and graphic courtesy of Toray Industries, Inc.
Figure 3. The produced water at a Queensland CSG plant is treated by a series of cylinders fitted with RO membrane cartridges that separate salts and other contaminants from the filtered permeate that exits through a central product tube. Three stages of RO filtration are outfitted with progressively finer membranes to produce water clean enough to be used for agricultural irrigation in the otherwise arid location.