
A Comparative Analysis Of UCMR 3 And UCMR 5 Of The Top U.S. Water Systems And Their Capital Improvement Projects For PFAS Remediation
By David Cox

The U.S. Environmental Protection Agency (EPA) has been monitoring the occurrence of PFAS in drinking water under the Unregulated Contaminant Monitoring Rule (UCMR), which requires public water systems to test for contaminants that are not regulated under the Safe Drinking Water Act. The UCMR program collects data every five years for different sets of contaminants. The third cycle of UCMR (UCMR 3) was conducted from 2013 to 2015 and included six PFAS: PFOS, PFOA, PFNA, PFHxS, PFHpA, and PFBS. The fifth cycle of UCMR (UCMR 5) is underway from 2023 to 2025 and includes lithium and 29 PFAS, the same six PFAS from UCMR 3, plus 23 additional PFAS. Note that the EPA has released the first and second data sets of UCMR 5, representing 15% of total results until data reporting is completed in 2026.
In this article, we will compare the PFAS contaminants present in UCMR 3 and UCMR 5 for some top water systems in the U.S., based on the population served, to examine the changes in their occurrence and levels over time. We will also discuss the projects by the water systems in their capital improvement plans for PFAS remediation in its water sources and to prevent further contamination. The article focuses on three scenarios: water systems that had PFAS detections in UCMR 3 but not in UCMR 5, water systems that had no PFAS detections in UCMR 3 but had PFAS detections in UCMR 5, and water systems that had PFAS detections in both UCMR 3 and UCMR 5.
Water Systems With PFAS Detections In UCMR 3 But Not In UCMR 5
One possible scenario is that a water system had PFAS detections in UCMR 3 but not in UCMR 5. This could indicate that the water system has taken measures to reduce or eliminate PFAS sources of contamination, such as changing water sources, installing PFAS treatment technologies, or implementing best management practices.
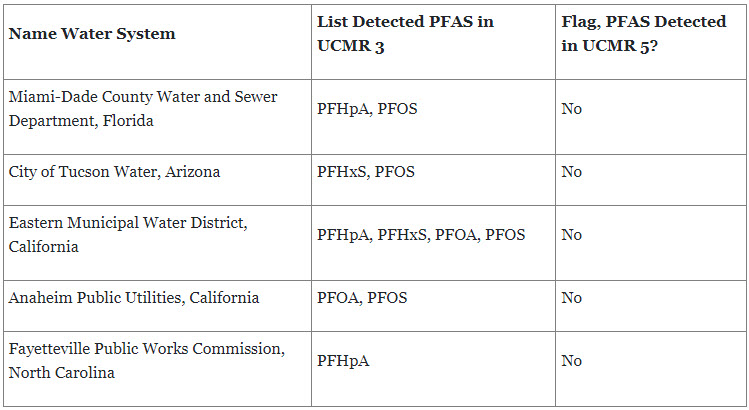
Table 1: Five Water Systems with PFAS Detection in UCMR 3. Source: FirmoGraphs
According to the UCMR 3 data, Tucson Water, Arizona, had detections of PFHxS and PFOS at levels ranging from 0.056 to 0.42 micrograms per liter (µg/L). To address the PFAS challenge, Tucson Water has shut down 18 backup drinking water supply wells affected by PFAS. It has undertaken several capital improvement projects in the 2023-2027 cycle for PFAS remediation from its water sources and to prevent further contamination, including the Northwest Well Treatment Systems ($75 million) and Drill Production Wells ($21 million).
Similarly, the Fayetteville Public Works Commission, North Carolina, had detections of PFHpA in Hoffner and Glenville water treatment plants (WTP) at levels ranging from 0.01 to 0.015 µg/L. Tucson Water has undertaken PFAS treatment technologies projects in its 2024-2033 capital plan. These projects include the construction of new Granular Activated Carbon (GAC) facilities at the Hoffner ($52 million) and Glenville Lake ($21 million) WTPs.
Water Systems With No PFAS Detections In UCMR 3 But In UCMR 5
Another possible scenario is that a water system had no PFAS detections in UCMR 3 but had PFAS detections in UCMR 5. This could indicate that the water system has experienced new or increased PFAS sources of contamination, such as industrial activities, firefighting foams, landfills, or wastewater discharges. Alternatively, this could also reflect the improved sensitivity and accuracy of the analytical methods used for UCMR 5, based on lower detection limits for PFAS than those used for UCMR 3. For example, with UCMR 3, the detection limit for PFOA was 0.02 µg/L, which decreased to 0.004 µg/L in UCMR 5.
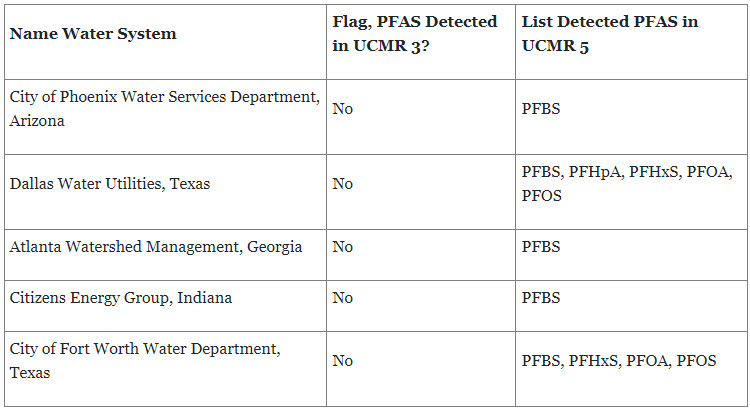
Table 2: Five Water Systems with PFAS Detections in UCMR 5. Source: FirmoGraphs
An example of a water system that had no PFAS detections in UCMR 3 but had PFAS detections in UCMR 5 is the City of Phoenix Water Services Department, Arizona, which had detections of PFBS at levels ranging from 0.007 to 0.016 µg/L. The department has planned to spend more than $191 million on designing and drilling groundwater wells for PFAS remediation and drought mitigation. Other vital capital improvement projects include the rehabilitation of Deer Valley ($68 million), Val Vista ($64 million), and 24Th Street Water ($32 million) WTPs.
Similarly, the Fort Worth Water Department, Texas, has detected PFBS, PFHxS, PFOA, and PFOS in UCMR 5, ranging from 0.0032 to 0.0258 µg/L. The department slated $115 million in the 2023-2027 capital plan for the Water Treatment Plants Minor Improvements project to remove harmful substances, including PFAS, at Eagle Mountain, North, South Holly, Rolling Hills, and Westside WTPs.
Water Systems With PFAS Detections In Both UCMR 3 And UCMR 5
The third possible scenario is that a water system had PFAS detections in both UCMR 3 and UCMR 5. This could indicate that the water system has persistent or ongoing PFAS contamination or that the water system has not installed effective PFAS treatment technologies.
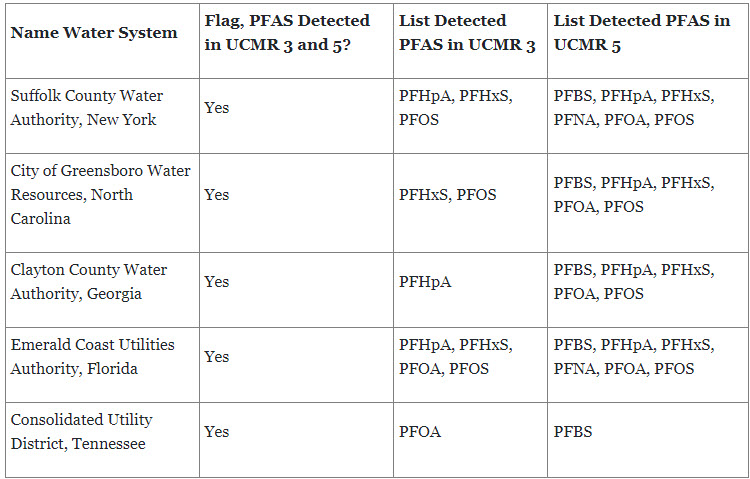
Table 3: Five Water Systems with PFAS Detections in UCMR 3 & 5. Source: FirmoGraphs
The Suffolk County Water Authority (SCWA), New York, has PFAS detected in UCMR 3 and 5. To address the PFAS issue, the SWCA allocated over $30 million for the Water Quality & Treatment Systems project in the 2024 fiscal year. Other significant capital improvement projects in the current plan are the Replacement of Existing Wells ($9 million), New Wells ($5 million), and Treatment Facilities ($4 million).
Similarly, Greensboro Water Resources, North Carolina, reported PFAS detection in both UCMRs at Townsend and Mitchell facilities. In its 2024-2033 capital plan, the city has undertaken Emerging Contaminant Treatment ($66 million), Mitchell - GAC Improvements ($59 million), and Townsend - Lab Expansion and Upgrades ($4 million) projects for PFAS remediation.

David Cox, PE, is President of FirmoGraphs, which curates and maintains a database of municipal, state, and federal Capital Improvement Plans containing 100,000s of projects categorized by region, business area, and phase to make it easy for engineering and construction professionals to find projects early and add them to their business development pipeline. Request a discovery meeting to view the database live in FirmoGraph’s business intelligence tool.