
Understanding Municipal Bonds And Their Benefits
By Kevin Thompson, managing director, Public Finance Investment Banking group of Raymond James and Jay Gorman, vice president, Raymond James General Industrials Group
An analysis of tax-exempt bonds, the water/wastewater market, and infrastructure funding
It’s pretty amazing when one stops to think about the fact that Americans typically pay two to three times for cable and Internet what they pay for water service. Cable and Internet services can easily run the average family nearly $200 per month, while rates for water and sewer services usually don’t crack $100 per month and often are below $50. Yet when one thinks about the necessity, capital intensity, and reliability of water as compared to other utilities, it ranks among the most vital, most consistent, and most capital-intensive. In a nutshell, water is by far the best value in utility services from both a rate and need perspective. So what drives this value?
In part, in the U.S., we’ve subsidized water rates for public utilities through the use of tax-exempt bonds. As with most developed nations, we place a high value on having a safe drinking water supply. We find it worthwhile to subsidize the capital investments made in our water infrastructure by excluding interest earnings on debt used to finance capital projects from taxation at the federal level. There’s been much discussion about privatization and/or public-private partnerships in the water and sewer sector, but many of these models appear to be based on European or developing nation models that lack the fundamental subsidy we provide to a capital-intensive sector. While public-private partnerships and privatization can be useful in certain circumstances, it’s important to understand the fundamental impact of tax-exempt debt on this sector.
Water and sewer entities are capital-intensive. Fixed assets tend to be a large component of most water and sewer utility balance sheets. As such, one would expect debt to be a major component of capital funding. On an asset-based approach, Fitch Ratings provides data that show the median debt-to-net-asset ratio is just below 50 percent across the industry. Based on Moody’s data, we find debt service payments average over 20 percent of revenue, or the annual cash flow requirements of a public utility, and this excludes any cash spent annually on capital needs.
Funding Costs
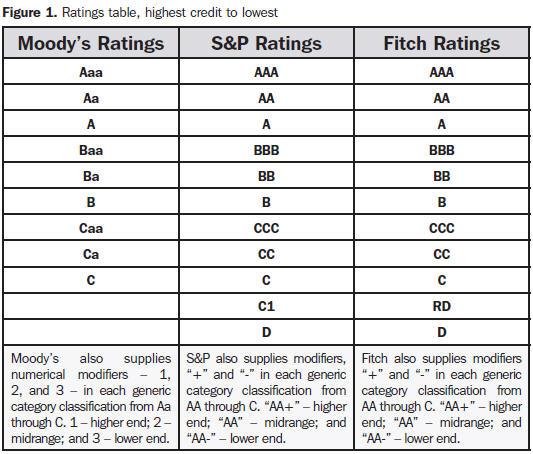
Capital funding for utilities comes in a variety of forms. Most common for public utilities is some combination of the following: paygo (or cash financed); direct debt; state revolving fund loans (or grants); and possibly short-term financing of construction in process. Direct debt of water and sewer utilities tends to be fairly consistent at about 10 percent of the overall tax-exempt bond market. From 2010 to 2013, annual water and sewer debt issuance ranged from $27.9 billion to $39.9 billion. Annual debt issuance can be further divided into refinancings and new debt for new projects. New capital project funding through debt ranged from about $15 billion to $28 billion over the same period. The rating agencies perform an independent review of a utility’s credit worthiness. The results of their analysis are shown through the use of letter grades, with “AAA” or “Aaa” being the highest, or best quality, and “BBB-” or “Baa3” being the lowest investment grade, or lower quality. Lower rating levels exist, but the investor market for these credits is significantly smaller. In looking at water and sewer credits, we find almost 90 percent of public water and sewer utilities are “AA-” or better, meaning these are good credit risks and should be able to achieve the best funding rates. Default studies performed by the rating agencies indicate water and sewer credits are some of the municipal sector’s best credits. Only three larger water and sewer utility credits are rated at the bottom of the credit spectrum for institutional clients — Detroit (due to the City’s Chapter 9 filing), New Orleans (post-Hurricane Katrina fallout), and Jefferson County Sewer in Alabama (due to an overly heavy reliance on synthetic debt and auction rate securities).
While it is difficult to show capital funding costs for a wide range of credits and structures, we can look to generic market indices to get an idea of the borrowing rate for publicly owned water and sewer utilities. The municipal market has an index from which bonds are typically priced with a spread — or the “add on” to the index. Published by Thomson/Reuters, the index is called the Municipal Market Data (MMD) AAA Index and is considered in laymen’s terms to be the equivalent of the Treasury curve for taxables (taxable bonds are typically priced with a spread to the Treasury curve). If we just look at the two basic indices — AAA MMD and the U.S. Treasury — for the 10-year maturity going back to January of 2000, we find that the tax-exempt index was on average 0.49 percent lower. Since 2000, we have had a record-setting, historically low interest rate environment. Typically, a low-interest-rate environment causes “rate compression” — a term used when low interest rates drive tax-exempt and taxable bond yields closer to each other than they would normally be. If we look prior to 2000, or the low-interest-rate period, the tax-exempt index is 1.35 percent lower going back to its creation in 1993.
In addition to the indices, the spread to the index also matters. We tend to find taxable spreads to be higher than tax-exempt spreads (the “add-on”). Spread levels are influenced by a number of factors, including differences in credit quality, state and local taxation laws, current market factors, news events, etc. While there is no proxy which incorporates spreads to compare taxable and tax-exempt rates, we can look at specific bond issues. Tucson, AZ, Raleigh, NC, and the Bay Area Water Supply and Conservation Agency, CA, all issued debt last year on both a tax-exempt and taxable basis, which we can use as indicators. Taxable spreads were higher by 0.37 percent, 0.26 percent, and 0.46 percent respectively at the 9-year maturity for each of these issuers:
- Tucson, AZ (Water System Revenue Bonds) — 2022 maturity tax-exempt spread: 44 basis points (bps); taxable spread: 81 bps
- Raleigh, NC (Combined Enterprise System Revenue Bonds) — 2022 tax-exempt spread: 14 bps; taxable spread: 40 bps
- Bay Area Water Supply and Conservation Agency CA (Revenue Bonds) — 2022 tax-exempt spread: 29 bps; taxable spread: 75 bps.
Coverage Requirements
Beyond credit spreads, tax-exempt bond issues can contain items unique to the structure. Bond issues that are solely based on the utility’s revenues as the source for debt payment tend to have coverage requirements and a debt-service reserve fund. Coverage requirements tend to require the utility to keep rates sufficient for some multiple of total debt payments either annually and/or before issuing more debt. Depending on the requirements of the bond documents, coverage can be calculated on total revenues or net revenues after the payment of operating expenses. A debt-service reserve fund can be thought of as a savings account embedded in the bond issue. Again, differences exist depending on bond documents, but often the size of the reserve fund will be required to equal a full year of debt service.
There are discussions as to whether these items are efficient in structuring the debt. Coverage requirements based on the utility’s revenues tend not to constrain the utility, as operating expenses absorb excess dollars. Coverage models based on revenues net of operating expenses need a use for the excess dollars not needed for debt-service payments. These dollars can be used for pay-go funding of capital or to pay subordinate debt, such as a commercial paper program for construction funding. Debt-service reserve funds are savings accounts and can be invested. In higher rate environments (or a steep yield curve), reserve funds can be invested at the yield on the bonds, making them somewhat neutral to overall borrowing costs (tax regulations provide a formula for determining the maximum earnings rate on the reserve fund, which is typically slightly lower than the all-in cost of borrowing for the utility). In low-yield markets like today’s, reserve funds tend to cost the utility money, as the earnings rate is less than the borrowing rate.
Municipal Borrowing And Performance
In addition to funding costs, public entities (including most municipal water systems) are subject to much greater public scrutiny than private enterprises. In part, public (and/ or political) accountability may also drive rate costs down. Often public entities are viewed as less efficient than their corporate counterparts, but we’ve certainly found that is not always true. Public entities tend to be constrained in their revenue growth (or ability to increase rates and charges) by executive or legislative bodies which seek to manage the overall tax burden on their constituents. Water and sewer utilities, which provide necessary services, tend to be further constrained, as it is not in the public’s best interest to cut off those who cannot afford to pay. Public accountability with constrained growth tends to force a level of efficiency one might not normally expect in the organization. Ultimately, most utilities do seek to run efficiently and often reduce operating and/ or construction costs through the use of outside vendors when high public employee wage requirements or onerous public procurement processes might drive costs up.
Looking to the future, much has been made of the state of the water infrastructure in the U.S. and the need for significant capital upgrades. While many have focused on the overall financial health of the country’s municipalities as the gateway to securing more water infrastructure funding, this is not always the case. As was stated earlier, water utilities are generally considered one of the highest credit entities in existence. If a utility needs capital investment and can derive the incremental revenue to support it, financing is most often available for those projects. The limitation in securing new capital generally is driven by the lack of incremental revenue.
Examining the current revenue landscape for water utilities, it is important to segment those that have ample supply and those that don’t. Thus, some utilities need conservation measures to manage supply, while others are facing customer conservation measures that result in declining revenues. Most water and sewer utility revenue models are consumption-based. Water charges are often based on a metered flow by pipe size and customer type, and sewer charges are often based on the metered water flow. Historically, increasing consumption could pay for additional capital needs or rising operating costs, and a rate increase was thought to directly correlate to a similar percentage increase in revenues. In today’s water environment, we find rate increases are necessary to simply maintain revenues at current levels as consumption declines — leaving little, if any, incremental revenue to fund capital projects. To remedy this situation, utilities are looking to new revenue models to fund their growing operating costs and capital needs. New revenue models range from moving to larger fixed-charge amounts as a percentage of the bill to more esoteric models such as peak-set base rate models. The latter tends to smooth a utility’s revenue or purchased quantity plans with higher rates for use above the purchased quantity.
As the industry moves forward, it is important to ensure we continue to utilize the benefits provided to the sector through tax-exempt bond issuance. Tax exemption provides significant subsidies to the sector, which ensures water and sewer utilities can continue to provide safe, reliable services for years to come.
 |
Kevin Thompson is a managing director with the Public Finance Investment Banking group of Raymond James. Thompson has more than 25 years’ experience structuring fixed-income securities for public and private entities. |
 |
Jay Gorman, vice president in the Raymond James General Industrials Group, has more than 10 years of corporate finance experience, having worked myriad successful acquisitions, divestitures, joint ventures, partnerships, and other strategic initiatives for diversified industrial and basic manufacturing companies. |