
The Future Of Pipeline Renewal
By Kipp Hanley
Where is your utility when it comes to water and sewer management? Leading municipalities are using GIS tools to provide direction.
The Prince William County Service Authority’s Enterprise Asset Management (EAM) Department is helping the utility further advance toward best-in-class status in the industry.
Formerly known as the Geographic Information Systems (GIS) Department, the EAM team is using an array of sophisticated tools and techniques to optimize the way the Service Authority manages its network of water and sewer assets. The EAM team’s vision is to become a nationally recognized utility department for leading enterprise-wide asset management through information technology innovation and system integration, exceptional data quality, spatial data analytics, and integrated workflows. EAM programs are being increasingly developed in the top tier of high-performing utilities.
“Our primary responsibility is to align the Service Authority’s vision and organizational strategies with a portfolio of enterprise asset management programs and projects. GIS is our most powerful tool in that effort,” said EAM Department Manager Brandon Pfleckl. “Our greatest priority right now is creating ways we can quantitatively measure and analyze risk for each asset, then use that information to improve our ability to perform data-driven planning.”
The tangible result of the EAM team’s efforts is a suite of GIS applications that allow Service Authority personnel to spatially access and analyze information from a variety of IT systems via a single point, whether in the office or field — greatly enhancing the ability of personnel to make clear, justifiable decisions in an efficient manner.
The technology backbone includes a GIS-centric IT architecture where the GIS database acts as an information hub into which other systems can be integrated. The EAM team has integrated GIS with the Service Authority’s computerized maintenance management system (CMMS), customer information system, and asset records databases. They are currently working to integrate with the systems control and data acquisition (SCADA), financial, and laboratory systems.
“When our folks are in the field, they will have a super-fast application that will be extremely reliable, giving them a tool to access a wide variety of information very quickly and analyze that information in a single context,” said GIS Specialist Yeoanny Venetsanos.
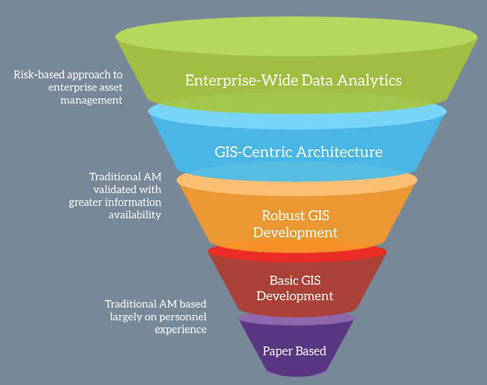
The evolution of enterprise asset management
GIS Applications
In the last fiscal year, the EAM team has created applications for several Service Authority divisions, including O&M, Environmental Services & Water Reclamation, and Engineering & Planning. Each application is customized to the users’ specific asset data viewing and analysis needs.
For O&M stakeholders, knowing the history of the work being done on those assets is a valuable tool, said O&M Division Director Don Pannell. For starters, customers’ questions can be resolved quickly by using the GIS application. When a customer sees a blue water line mark on the street and a torn up sidewalk in front of their house, sometimes they assume it is the work of the Service Authority, said Pannell. By using the GIS-based Work Order History app, management can zero in on the neighborhood and immediately identify whether there has been any recent work done by the Service Authority in the area.
“If there is a mess in a ditch, we can look in our order history and say to the customer, ‘Yes, there was a water main break last week,’” Pannell said. “It’s a lot more satisfying to customers when we can tell them definitively what the issue is.”
Using the GIS application to access work orders rather than the CMMS system can be beneficial in planning, said Pannell. As an example, a search on the CMMS can indicate how many breaks there are on a particular street and the block number. However, by zooming in on the exact location of where most of the breaks are happening through the work order history app, management can quickly understand where on the street a project may need to be done in the future.
Additionally, the GIS application can be used to locate assets with relatively high precision. For example, whether due to difficult terrain, snow cover, over-paving, or property changes, finding the precise locations of meters and other assets can be a difficult chore. By using the GIS applications and integrated GPS technology, users can see their position in the field relative to the buried utility assets underground. Users can simply walk toward the asset until their position is shown on top of the asset location, saving a great deal of time and effort.
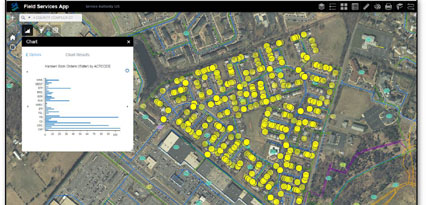
A screenshot from Prince William County Service Authority’s GISbased Work Order History app
“Sometimes on the service orders, it may say some something like [the meter is] in the left rear or on the right side of a property, very general information about the location of the meter,” said Mark Head, field services manager. “The GIS gives them a picture of where the meter should be located and the user’s position relative to the asset location.”
Field personnel can pull customer account details from the GIS app, saving additional time. Consumption history, customer contact information, meter type and installation history, service order history, and other account details can be gathered and studied in a few seconds in the field as compared to many minutes or hours previously.
Users can also analyze consumption trends for a customer (or an aggregate of the neighborhood) to see if there has been a spike in water usage, potentially indicating a leak at the residence. In the near future, users will be able to compare the customer consumption data with SCADA data to help identify localized water loss in the system.
Charting The Future
Building GIS applications that leverage data from several IT systems is just the beginning. At this point, the Service Authority has made tremendous strides to make existing workflows more efficient. The next challenge is finding ways to analyze the vast amounts of utility data in new ways to expand data-driven decision-making.
Quantitatively measuring asset risk at the individual asset level to improve risk-based planning and forecasting could provide a variety of benefits. Examples include CIP (capital improvement plan) repair-and-replace planning to determine what CIP plan will yield the lowest risk number at the least cost to ratepayers over time, greater precision with preventative maintenance planning to target high-risk assets first, and refined asset deterioration curves based on empirical data mapped in a GIS environment.
“By assigning a risk score to each asset, based on the consequence of failure of that asset and the likelihood that an asset will fail, the Service Authority will be in a much better position to precisely target CIP repair-and-replacement planning to maximize the positive impact of every dollar spent,” stated Pfleckl.
The Service Authority is committed to operating as a best-in-class utility, and GIS technology is a centerpiece of that vision. As GIS data, workflows, and applications evolve, the EAM team will integrate additional systems and provide new ways of analyzing data.
About The Author

Kipp Hanley is a copywriter for the Prince William County Service Authority.