
State Of The States: Emerging Water Loss Regulations In The U.S.
By Will Jernigan, P.E., director of Water Efficiency, Cavanaugh
Where does your state stand – both statistically and strategically – with regard to water loss?
Water system regulations in the U.S. have been around for 100 years. Forty years ago, Congress passed the State Drinking Water Act that brought sweeping changes for America’s drinking water systems. For nearly all of that time, those regulations have been solely focused on water quality. Only in recent years has the issue of water quantity found its place in the regulatory arena.
It is important to recognize that resources — both environmental and financial — will become more restricted with time, not less. Management of water loss is “supply-side” conservation — that is, reducing wasteful losses that occur on the utility’s side of the customer meter. Historically, conservation has been a more common practice in the western U.S., where arid climates and severely restricted supply set the stage. Recent water loss legislation in the eastern U.S. has begun to bring conservation and supply-side efficiency to the center stage, particularly in the Southeast. The EPA put out a report in 2013 articulating the importance of water auditing and water loss control, recognizing the emerging adoption of best practices to address an already prevalent issue.
Drivers Can Be Different
So why do we care about water loss? Just in the U.S., the drivers that make water loss important can vary widely from state to state, even utility to utility. For some, there are extreme drought conditions or arid environments with constrained water supplies that make water loss management a necessary source of new supply and resource stewardship. For some, it’s a plain bottom line. There are strained budgets, with expenses outpacing revenues and they see water loss management as fiscal shoring. They understand the inherent business case for system efficiency, including the complex but proven dependency between water and energy. For some, the driver is political — where pending rate increases fuel customer distrust and outrage (“You’re asking me to pay more for your inefficiencies?”), where water loss management provides defensibility and action and an offset to the severity of the required rate increases. For others, as is the case in Georgia and Tennessee, a primary driver is regulation. While there tends to be a primary driver, in most utilities all of these drivers exist to some degree. For this reason, the cost of doing nothing far exceeds the cost of water loss management in both the short and long term.
Water Loss, Exposed
We must understand the nature of any problem to stand a chance of solving it. The tricky part about water loss is that it’s not a singular problem. Water loss has multiple components, each having multiple subcomponents, and there is not a single tool or technique for universally addressing all components. Thus, a collective strategy must be developed and designed to appropriately target each subcomponent.
Figure 1: AWWA Water Balance
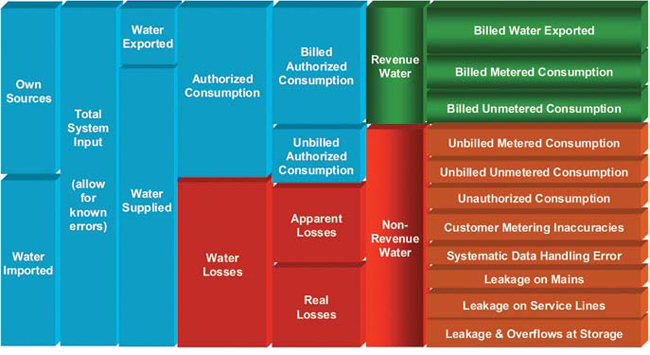
So what is water loss made of? Chances are by now you have seen or heard much of this, but it bears repeating. The Water Audit Method developed by the International Water Association and the American Water Works Association (AWWA) defines water loss on the basis of the Water Balance (see Figure 1). Water loss is derived as “real losses” plus “apparent losses.” Real losses are physical losses from the distribution network, via leakage from mains, services, and storage tanks. Apparent losses are economic, nonphysical losses that result from underregistering customer meters, underbilling of customers, and theft. Imbedded into the Water Audit Method is the Data Validity score — a measure of confidence and reliability in the Water Audit outputs.
Data Validity must be your first consideration in using the Water Audit to guide water loss management activities. Systems with low Data Validity scores must focus next steps on improving data. Those with high Data Validity should focus next steps on reductions in water loss. Those with medium Data Validity scores must examine closely to determine the appropriate balance of next steps for data improvement and water loss reduction.
All systems have water loss, and all systems have some of each component — real losses and apparent losses. The big question is how much of each, and what are the cost impacts of each? This is central to any effective strategy. Consider the importance of applying the right strategy to the right problem. How effective will implementing a comprehensive customer meter testing and replacement program be for solving a leakage problem? How about an active leak-detectionand- repair program for solving systemic billing system issues? And consider the cost effectiveness of any strategy, even if it’s the right tool for the job. Are we spending a $1,000,000 on a $500,000 problem? An effective strategy — for both results and cost — must match the problem in both scale and nature.
State Of The States
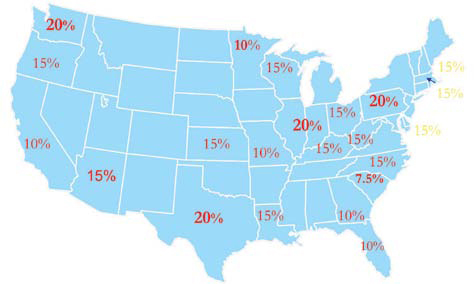
In 2002, an analysis of state agency water loss reporting practices was conducted by Beecher Policy Research, Inc. Two primary conclusions came from this survey — the first was the widespread use of the performance term “unaccounted-for water percentage” and the second was a clear inconsistency in what was considered “acceptable loss” (see Figure 2 on page 10). AWWA has long since denounced use of the imprecise term “unaccounted-for water” (UFW), as well as percentage-based metrics, as they have been deemed inconsistent and unreliable as performance measures. UFW has been abandoned as an “old technology,” joining the likes of the 8-track and rotary phone. In its place the IWA/AWWA Water Auditing Methodology, as defined in the M36, Manual of Practice for Water Audits & Loss Control (M36 method), is recognized world-wide as best practice in the industry for the accounting and control of losses in drinking water systems. Central to the M36 method is the rational segregation of real (physical) and apparent (economic) losses and analysis of the components of each type of loss, which informs an effective control strategy.
Figure 2: 2002 states survey of “unaccounted-for water” standards
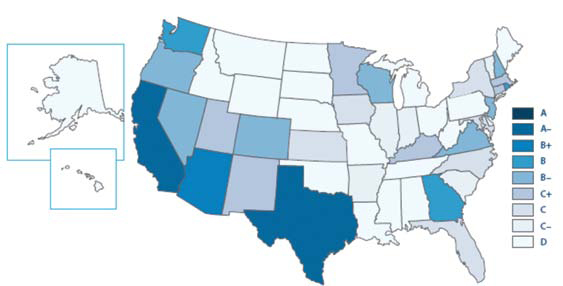
An analysis in 2005 on water loss policy and regulation further describes a highly fragmented and complex water supply and regulatory structure. The complexities stem from the sheer volume of regulated community water systems in this country (more than 54,000), as well as the intricate framework of regulatory agencies — often multiple agencies in a given state with varying regulatory jurisdiction, and sometimes agencies that regulate water systems across multiple state borders. Further research6 was conducted by the Alliance for Water Efficiency in 2011-12, revealing that through the network of regulatory agencies, an indication of regulatory momentum is beginning to emerge in the water loss arena.
Figure 3: 2011 states scorecard for water efficiency policy
Clearly, there have been significant evolutions in water loss policy and regulation in just the last 10 years. The scope of the research presented in this article is focused on identifying where a framework for water loss auditing and reporting exists today, where there are performance targets, and which states or agencies align their requirements with the best practices of the M36 methodology. The research methodology consisted of compilation and review of regulatory texts (existing and proposed), statewide planning documents, sanitary surveys, state funding applications, and policy memorandums as available from states across the U.S.
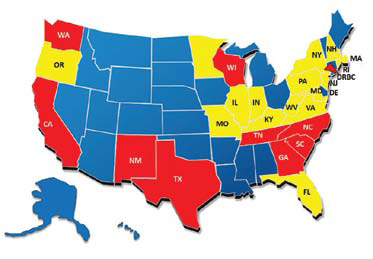
Figure 4: States with water loss regulatory or policy framework (2013 statistics)
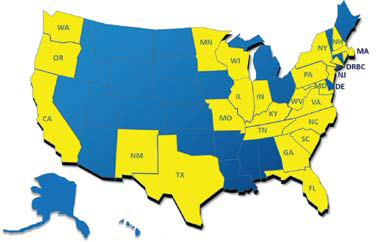
Figure 4 above presents the landscape of states where at least some type of framework exists for water loss auditing, reporting, and performance targets. The format of this framework varies widely from state to state. In some cases, water loss auditing, reporting, and/or performance targets are required by mandate, with varying degrees of penalty for enforcement. In other cases, water loss auditing, reporting, and/or performance targets are not required, but are otherwise incentivized through priority on state funding applications, consideration for new withdrawal permits, or other means.
Figure 5 on page 11 presents those states where that regulatory framework exists, and it directly aligns with or references the best practices of the M36 method for water auditing and loss control.
California and Texas were the first states to adopt M36 as the required methodology. Most recently, Georgia, Tennessee, and Wisconsin have joined them in adopting the M36 requirement. Similarly in California, the requirement only applies to those utilities that are part of the California Urban Water Conservation Council (CUWCC). The Delaware River Basin Commission (DRBC), while not a state, instituted a requirement in 2013 for all M36 auditing by most water systems under its regulatory purview — about 300 utilities including Philadelphia, Aqua Pennsylvania, and New Jersey American Water. M36 auditing is incentivized in New Mexico via consideration for new permit applications, in North Carolina via priority points for SRF applications, and in South Carolina via incorporation into annual surveys conducted by state inspectors. Among others requiring M36 auditing, only California, Tennessee, Georgia, and the DRBC use the AWWA Free Water Audit Software as the required format for submittal. This software was developed and released by AWWA to provide the industry with a standard format for the water audit, along with a free compiler tool to allow ease of collection and analysis for large numbers of water audits. The current version of the Free Water Audit Software (v4.2) was released in 2010, and the next version (v5.0) is due out in mid-2014.
Figure 5: States with water loss regulatory or policy framework per AWWA M36 method (in red), as of 2013
A trend that has been reported by most of the M36 early adopter states is an inherent challenge in the reliability of many of the audits submitted, citing examples of errors and anomalies such as water loss greater than 100 percent or less than 0 percent. These challenges are largely attributed4 to the lack of understanding for the auditing process (as many utilities are conducting these audits for the first time), quality control on the audit data inputs, and the “top-down” nature of the initial audit. The DRBC reported that approximately 100 of the 300 audits initially submitted in 2013 were not suitable for analysis, requiring extensive cleanup of errors and anomalies. In California, the CUWCC reported that among audit submittals from 2010, 36 percent were unsuitable for analysis due to errors. The Texas Water Development Board and Tennessee Comptroller’s Office have reported similar challenges since they began collecting water audits in 2005 and 2007, respectively. In Georgia, a statewide training and data validation initiative was conducted for the 200+ water systems subject to the water auditing and reporting requirement beginning in 2012. The training and validation initiative was ordered because the presence of unvetted audits and their performance indicators undermined the credibility of the entire dataset, and the auditing process as a whole.
A survey of the regulatory landscape today reveals growing regulatory momentum for water loss in the industry and a foundational need for education, training, and validation per the AWWA M36 auditing and loss control methodology. A look back at prior research efforts on this topic reveals that much has changed in a short amount of time. A look ahead at leading indicators — such as draft M36 legislation in New Hampshire, or M36 policy objectives established in statewide water conservation planning documents in Oklahoma and Hawaii — suggests that we may see an increasing rate of change in the future.
References
- EPA Report “Water Audits and Water Loss Control for Public Water Systems” http://water.epa.gov/type/ drink/pws/smallsystems/upload/epa816f13002.pdf
- Kunkel, G. et al. Applying Worldwide Best Management Practices in Water Loss Control, AWWA Water Loss Control Committee Report, Journal AWWA, August 2003.
- Survey of State Agency Water Loss Reporting Practices. 2002. Beecher et al.
- Manual of Water Supply Practices — M36, Water Audits and Loss Control Programs. 2009. 3rd Edition. American Water Works Association.
- Developments in Water Loss Control Policy and Regulation in the United States. 2005. Kunkel, G. Leakage 2005 Proceedings.
- Sayers, D. DRBC CY2012 Water Audit Program Summary. Presentation to DRBC Water Management Advisory Committee, October 2013.
- Sturm, R. Summary of Report of BMP 1.2 Water Audit Data. Prepared for the California Urban Water Conservation Council. 2011.
- Moeti, L., Ph.D. Water Audit Results for Large Georgia Public Drinking Water Systems for 2011. Report for Georgia Environmental Protection Division Watershed Protection Branch. January 2013.
- Dickinson et al. The Water Efficiency and Conservation State Scorecard – An Assessment of Laws and Policies. Prepared by the Alliance for Water Efficiency and Environmental Law Institute. September 2012.
- Draft Rule Amendments for PART Env-Wq 2101, eff. 5-14-05 (doc #8353). New Hampshire Administrative Code, proposed amendments 05-03-13.
- Hawaii Statewide Water Conservation Plan. Hawaii DLNR-Commission of Water Resources Management. February 2013.
- Oklahoma Comprehensive Water Plan. Oklahoma Water Resources Board. October 2011.
 Will Jernigan, P.E., is the director of Water Efficiency with Cavanaugh, and is an industry expert in water efficiency with a focus on water loss control and revenue recovery.