
An Environmental Impact Study On The Manufacture, Production, And Transport Of Onsite Wastewater Treatment Systems
A comparison of conventional and recycled thermoplastic systems
By Jessica Kautz, E.I.T. , Project Engineer, Infiltrator Systems Inc.
Abstract
Global concern is growing over natural resource consumption and climate change. Many governments, companies, and industries are taking action to reduce the environmental footprint associated with material and product manufacture and processing. Both natural resource consumption and greenhouse gas emissions are being monitored closely as resource shortages and emissions continue to rise globally.
Onsite wastewater treatment systems have historically been composed of concrete septic tanks and stone/pipe drainfields. However, the processes and materials used to manufacture conventional systems consume a large amount of resources (aggregate, water, fuel, electricity) and emit a large amount of carbon dioxide. Alternatively, other materials have been increasingly substituted for conventional materials, including recycled thermoplastic septic tanks and chambers. These materials have qualitatively been considered more environmentally friendly, but no quantitative comparison has been evaluated in regards to resource consumption and carbon emissions.
Therefore, the environmental impacts of both conventional septic systems and systems using recycled thermoplastics were evaluated. A conventional septic system was defined as a precast concrete septic tank and gravel/pipe drainfield. This was compared to the equivalent recycled thermoplastic system, consisting of a septic tank and chambers. Water consumption, electricity consumption, fuel consumption, and carbon emissions were evaluated through raw material production, product manufacturing and transportation for both systems. Installation of the system was not included in this study, as the method and ease of installation varies greatly among sites.
It was concluded that there is a significant difference in the environmental impact associated with each system type. When transporting a recycled thermoplastic system 1000 miles and a conventional system only 30 miles, the recycled system reduced electricity consumption by 85% (5468 kWh saved), fuel consumption by 67% (4480 kBtu saved), water consumption by 97% (950 gal saved), and carbon emissions by 34% (148 kg C saved). When compared to the total number of septic systems installed each year (estimated at 400,000 installed septic systems in 2013), this could amount to a total yearly savings of 2.2 billion kWh of electricity, 1.8 billion kBtu of fuel, 380 million gallons of water, and 59 kilotons of carbon if every septic system was composed of recycled thermoplastics rather than conventional materials.
Introduction
Concern is growing globally over natural resource consumption and climate change. Many governments, companies, and industries are taking action to reduce the environmental footprint associated with material and product manufacture and processing. The onsite wastewater treatment (septic system) industry currently treats the wastewater generated by nearly 25% of US households and up to 33% of new developments, amounting to approximately four billion gallons of wastewater treated per day (USEPA, 2005). With the vast number of systems installed daily, it is important that the most sustainable methods are employed in all aspects of construction, manufacture, treatment, and disposal.
Septic systems have conventionally consisted of a precast concrete septic tank, followed by a gravel and pipe drainfield. While these materials have provided adequate treatment and dispersal of wastewater for years, they are also energy and resource intensive to manufacture and process. By weight, concrete is composed of approximately 15% cement and 85% aggregates; cement is manufactured from limestone and clay. The conventional septic system is, therefore, completely reliant upon mining and processing natural gravel resource, a resource intensive process (DOT FHWA, 2012).
Gravel quarries typically begin the mining process by blasting or drilling into the natural landscape using heavy machinery to extract large stones. These are then sent through a series of machines to crush and screen (sort) the natural aggregate into various sized stockpiles. Depending on its intended use, the aggregate often must be washed to ensure it is free of “fines” (small diameter rock and soil particles). The mining process therefore involves a large amount of fuel and water consumption to run the machinery and wash the aggregate, on top of the large amount of natural resource consumption (USEPA, 2004).
In addition, the manufacturing of cement revolves around the chemical reaction of calcination. Calcination involves heating limestone (primarily calcium carbonate, CaCO3) to form calcium oxide (CaO) and carbon dioxide (CO2), as shown in Equation 1. When combined with clay, often aluminum silicate (Al2SiO5), the products become alite (3CaO·SiO2), aluminum oxide (Al2O3), and carbon dioxide, as shown in Equation 2. Aluminum oxide and alite are two of the main components of cement (MAST, 1995).

The manufacture of cement is therein both energy intensive (heat) and high in greenhouse gas emissions (CO2). Of the total carbon dioxide emitted by the United Kingdom concrete industry, approximately 85% is estimated to be from the manufacturing of cement. 60% of these emissions are estimated to be from the calcination process, and 40% from fuel combustion to heat the limestone and clay (Concrete Centre, 2009).
Alternative materials have been more recently introduced to the septic industry, utilizing recycled thermoplastics to manufacture septic tanks and drainfield products (i.e. chambers). The manufacture of recycled thermoplastic products involves the removal of plastic waste from landfills and junkyards, the processing of the plastic into regrind, the melting of the regrind to liquid plastic, and the molding of the recycled thermoplastic products using electric machinery. While these products have been qualitatively considered more environmentally friendly by using recycled materials, the goal of this paper is to quantitatively compare the manufacture and transportation of both a conventional concrete/aggregate septic system and a system of recycled thermoplastic components.
Methods and Calculations
An analysis was performed to quantitatively determine the resource usage and carbon emitted in the manufacture and transport of both a conventional septic system and a system utilizing recycled thermoplastic products. The conventional system for this study is defined as a 1000 gallon, precast concrete septic tank and a 1000-sf stone drainfield using 3-inch PVC piping for distribution. The recycled thermoplastic system is defined as Infiltrator Systems, Inc.’s (Infiltrator) IM-1060 septic tank and a 1000 sf drainfield of Quick4 Standard chambers. The analysis included raw material processing, manufacture of the finished product, and transportation of the product to the field site. Resources compared were water, electricity, and fuel. The installation of each system was not included in this study do to the varying ease and method of installation among sites.
For the conventional system, the transportation distance was assumed to be 30 miles to account for availability of local materials; for each conventional system, one truck carrying one tank and one truck carrying the amount of stone required for the drainfield each travel 30 miles to deliver the conventional system to the worksite. Material properties and coefficients for emissions, water, fuel, and electricity consumption were found through literature review. The majority of conventional system consumption coefficients were sourced directly from the concrete industry. These values represent a best case scenario for the concrete industry, as most literature cites consumption rates much higher than those reported directly from the concrete industry.
In calculating resource consumption of the recycled thermoplastics system, three different flatbed transportation distances (30, 500, and 1000 miles) were used to account for various distances from the manufacturing plant to distributors in flatbed shipping densities. A distance of 30 miles was then used to calculate the distance traveled from distributor to the installation site in two pickup trucks total, one transporting the tank and one transporting the chambers. The recycled thermoplastics system analysis was calculated using both a drainfield sized with a 25% reduction and a drainfield sized 1:1 with a conventional system; while the 25% reduction is common throughout US regulations, the 1:1 drainfield sizing gives a more direct correlation between the two systems and was used through the remainder of analyses. Resource consumption, carbon emissions, and number of products produced were monitored over six months of production at the Infiltrator Winchester, KY manufacturing plant. This data was used to determine the resource consumption and carbon emission coefficients.
Values for electricity use, fuel consumption, water consumption, and carbon emissions were calculated for both of the systems. Each system was also analyzed to determine the percentage of each constituent used in each production phase (raw material processing, production, transportation) and for each material (concrete, aggregate, PVC, cement, plastic). Various subsets of each system were then quantitatively compared, including the septic tanks alone, the drainfields alone, and the effect of transportation distances on system consumptions.
Results
Conventional System
Resource consumption and carbon emissions of the conventional system are shown in Table 1. As shown, the conventional system consumes 6433 kWh of electricity, 6674 kBtu of fuel, 983 gallons of water, and emits 431 kg C through the production, manufacture, and transportation of the system. Table 2 and Figure 1 depict the breakdown of each of these constituents into tank and drainfield contributions. As shown, the drainfield accounted for 81% of the electricity consumption, 61% of the fuel consumption, 79% of the water consumption, and 54% of the emissions.
Table 1. Conventional System Results
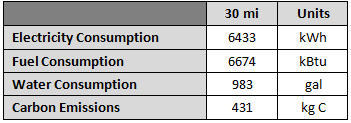
Table 2. Conventional System Usage - Breakdown into Components
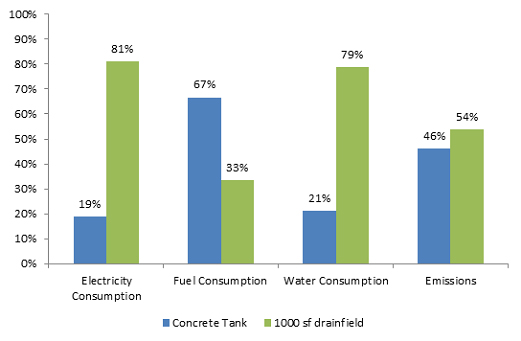
Figure 1. Tank and drainfield contributions to resource consumption and emissions
The conventional system was also analyzed by phase. The results of this analysis are shown in Table 3 and Figure 2. As shown, electricity consumption is dominated by the production phase. Fuel consumption is dominated by the material processing phase. Water consumption is dominated largely by the material processing phase, and carbon emissions are fairly split between the material processing and production phases.
Table 3. Conventional system (1000 sf drainfield, 30 mi travelled) – Consumption by phase
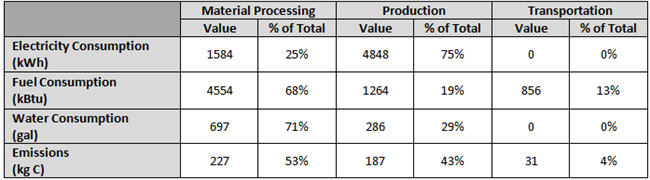
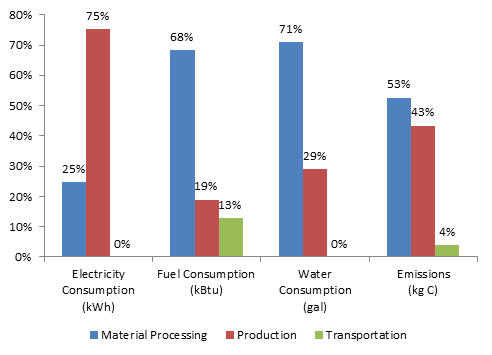
Figure 2. Conventional system consumption breakdown by phase
The conventional system was also analyzed to determine the percent contributions of each manufactured material. Results from this analysis are shown in Table 4 and Figure 3. As shown, PVC manufacture is the highest consumer of electricity, accounting for 71% of the system’s electricity consumption. Aggregate and cement consume the most fuel, both around 40% of the total fuel consumption. Aggregate also consumes the most water with 70% of the total water consumption. Cement and PVC production emit the highest amount of carbon, 39% of the total carbon emissions.
Table 4. Conventional system breakdown by material
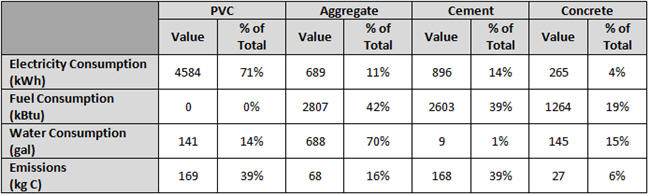
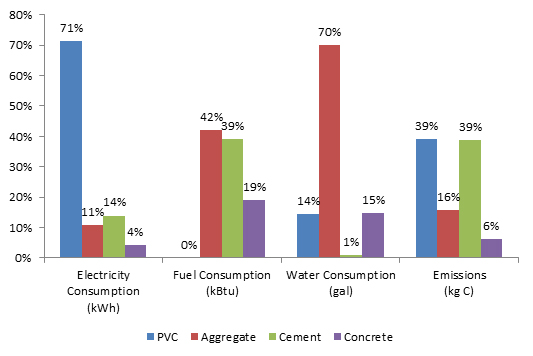
Figure 3. Conventional system breakdown by material
Recycled Thermoplastic System
The results from the recycled thermoplastic system with a 25% reduction are shown in Table 5. The results from the full-sized recycled thermoplastic system are shown in Tables 6. Table 7 and Figure 4 also show the tank and drainfield system contributions with a fully sized drainfield.
Table 5. Recycled thermoplastic system (1000sf drainfield with 25% reduction)
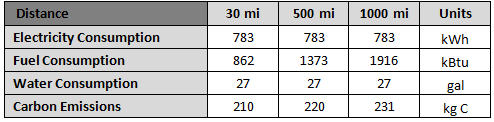
Table 6. Recycled thermoplastic system (1000 sf drainfield, no reduction)
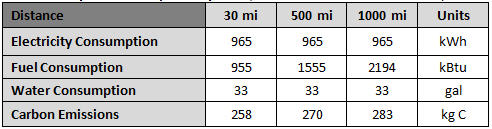
Table 7. Recycled thermoplastic system (no reduction, 30 mi distance) - Breakdown of components
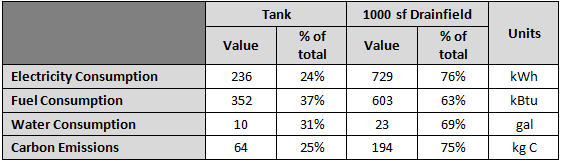
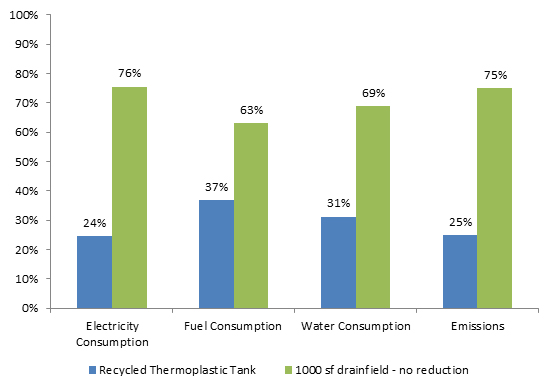
Figure 4. Recycled thermoplastic system comparison with and without drainfield reduction
The recycled thermoplastic system results were also analyzed to determine the contributions of resources/emissions for each stage – material processing, production, and transportation. The results from this analysis can be seen in Table 8 and Figure 5.
Table 8. Recycled thermoplastic system (1000 sf system, no reduction, 1000 mi distance) – Consumption by phase
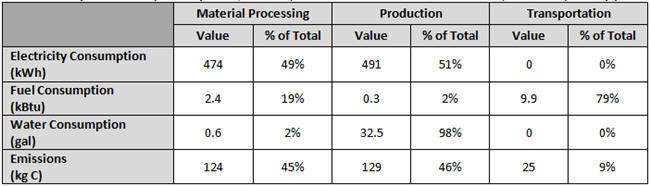
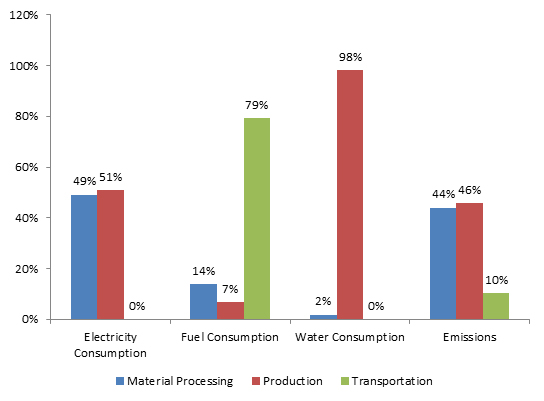
Figure 5. Recycled thermoplastic system (1000 sf system, 1000 mi distance) - breakdown in consumption by phase
As shown, the electricity consumption and carbon emissions are evenly split between the material processing phase and the production phase. Fuel consumption is dominated largely by transportation, and water consumption is dominated largely by the production phase.
Maximum Consumption Scenario
The maximum consumption scenario for the recycled thermoplastics system analysis was determined to be the farthest distance (1000 miles) with no drainfield size reduction. This scenario was therefore compared to the conventional system to quantitatively analyze the resource consumption and carbon emissions of the two systems.
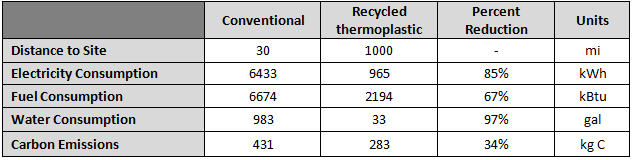
Results from the analysis are shown in Table 9. At maximum consumption, the recycled thermoplastic system uses a total of 965 kWh of electricity, 2194 kBtu of fuel, 33 gallons of water, and emits 283 kg C into the atmosphere. Comparatively, the conventional system uses 6433 kWh of electricity, 6674 kBtu of fuel, 983 gallons of water, and emits 431 kg C. This is equivalent to an 85% reduction in electricity usage, 67% reduction on fuel use, 97% reduction in water usage, and 34% reduction in carbon emissions.
Table 9 – Maximum value comparison – no sizing reduction – 1000 sf drainfield
Effect of Transportation
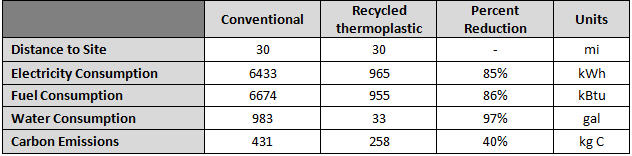
The systems were also compared at an equal travel distance (30 miles). The results from this analysis are provided in Table 10. As shown, the recycled thermoplastic system provides an 85% reduction in electricity, 86% reduction in fuel, 97% reduction in water, and 40% reduction in emissions, compared to the conventional system.
Table 10 – Equal distance comparison – no sizing reduction – 1000 ft2 drainfield
Septic Tank Comparison
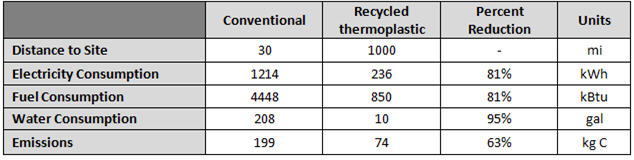
The 1000-gallon precast concrete septic tank was compared with the recycled thermoplastic septic tank alone. The results from this analysis are provided in Table 11. As shown, the recycled thermoplastic tank uses 81% percent less electricity, 81% less fuel, 95% less water, and emits 63% less carbon than the precast concrete tank.
Table 11. Septic Tank Comparison
Drainfield Comparison
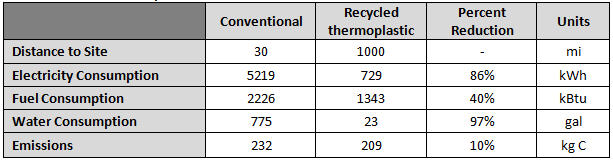
The 1000-sf conventional drainfield was compared with the 1000-sf, no reduction, recycled thermoplastic chambers drainfield. The results from this analysis are provided in Table 12. As shown, the recycled thermoplastic chambers use 86% percent less electricity, 40% less fuel, 97% less water, and emit 10% less carbon than the stone/pipe drainfield.
Table 12. Drainfield comparison – no reduction
Discussion and Conclusion
The recycled thermoplastic system consumes significantly less resources and emits less carbon than the conventional system. When comparing the “maximum usage” scenario of the thermoplastic system to the conventional system, the thermoplastic system consumes 85% less electricity, 86% less fuel, 97% less water, and emits 40% less carbon than the conventional system; at equal distance, the savings are even greater.
The majority of fuel and emissions savings for the thermoplastic system are from the septic tank. The thermoplastic tank uses 81% less fuel and causes 63% less carbon emissions than the concrete tank. This is largely due to the cement manufacturing process involved in concrete tank production; cement production accounts for 39% of the total conventional system fuel consumption and carbon emissions.
Electricity and water savings are slightly higher through drainfield comparison. This is expected due to the high electricity usage in PVC production (71% of total conventional system usage) and high water consumption in aggregate processing (70% of total conventional system usage).
In every analysis the recycled thermoplastic system consumes fewer resources and emitted less carbon into the atmosphere than the conventional system, regardless of distance travelled or system component. It can therefore be concluded that the use of recycled thermoplastic septic system products over conventional products is a more sustainable approach to onsite wastewater treatment. When compared to the total number of septic systems installed each year (estimated at 400,000 installed septic systems in 2013), this could amount to a total yearly savings of 2.2 billion kWh of electricity, 1.8 billion kBtu of fuel, 380 million gallons of water, and 59 kilotons of carbon if every septic system was composed of recycled thermoplastics rather than conventional materials.
References
Engineering Toolbox. (2013). Standard dimensions and weight of pvc and cpvc. (http://www.engineeringtoolbox.com/pvc-cpvc-pipes-dimensions-d_795.html).
IPCC. (2006). 2006 IPCC Guidelines for National Greenhouse Gas Inventories, Prepared by the National
Greenhouse Gas Inventories Programme, Eggleston H.S., Buendia L., Miwa K., Ngara T. and Tanabe K. (eds).
Published: IGES, Japan.
Kermeli, K., Worrell, E., & Masanet, E. U.S. Environmental Protection Agency, Climate Protection Partnerships Division. (2011). Energy efficiency improvement and cost saving opportunities for the concrete industry (LBNL-5342E). (http://www.energystar.gov/ia/business/industry/downloads/Energy_Efficieny_Improvement_Cost_Saving_Opportunities_Concrete.pdf).
Malin, N., & Wilson, A. (1994, January 1). Should we phase out pvc?. Environmental building news. (http://www.buildinggreen.com/auth/article.cfm/1994/1/1/Should-We-Phase-Out-PVC/).
Materials Science and Technology Workshop (MAST). (1995). Concrete module: Scientific principles. University of Illinois Department of Materials Science and Engineering. (http://matse1.matse.illinois.edu/concrete/prin.html).
Natural Resources Canada (NRC), Office of Energy Efficiency. (2001). Energy consumption benchmark guide: cement clinker production(M27-01-1464E). (http://oee.nrcan.gc.ca/sites/oee.nrcan.gc.ca/files/pdf/publications/industrial/BenchmCement_e.pdf).
State of Montana, Department of Transportation. (2010).Administrative rules of montana (Rule 18.10.324(5)(b)). (http://www.mtrules.org/gateway/ruleno.asp?RN=18.10.324).
Supple, D. (2010). Units & conversions fact sheet. Massachusetts Institute of Technology Energy Club. (http://www.carbonlighthouse.org/wp-content/uploads/2010/10/UnitsAndConversions.pdf).
The Concrete Centre. (2009). The concrete industry sustainability performance report. (1 ed.). Camberley, UK: The Concrete Centre. (http://www.britishprecast.org/10063CCSCSPerformanceReportFinal.pdf.pdf).
U.S. Department of Transportation, Federal Highway Administration. (2012). User guidelines for waste and byproduct materials in pavement construction (FHWA-RD-97-148). (http://www.fhwa.dot.gov/publications/research/infrastructure/structures/97148/app2.cfm).
U.S. Environmental Protection Agency, Office of Air Quality Planning & Standards. (2004).Compilation of air pollutant emissions factors(AP-42). (http://www.epa.gov/ttn/chief/ap42/ch11/final/c11s1902.pdf).
U.S. Environmental Protection Agency (USEPA), Office of Wastewater Management. (2005). Handbook for managing onsite and clustered (decentralized) wastewater treatment systems (EPA-832-B-05-001). (http://water.epa.gov/aboutow/owm/upload/2005_12_20_septics_onsite_handbook_fs.pdf).
Walker, F.R. (1986). The Building Estimator's Reference Book. Frank R. Walker Company. Chicago, IL.
Worrell, E., & Galitsky, C. U.S. Environmental Protection Agency, Climate Protection Partnerships Division. (2008). Energy efficiency improvement and cost saving opportunities for cement making (LBNL-54036). (http://www.energystar.gov/ia/business/industry/LBNL-54036.pdf).
About the Author
Jessica L. Kautz, E.I.T., Project Engineer, Infiltrator Systems
Jessica recently joined Infiltrator Systems as a Project Engineer after graduating with her M.S. in Civil and Environmental Engineering from the Colorado School of Mines and her B.S. in Civil Engineering with and Environmental Concentration from the University of Hartford. Jessica has spent her time at Infiltrator working closely with both the Research & Development and Science & Government Affairs Departments to research, develop, and gain approval for new products.