
Balancing The Costs Of Water For Utilities And Customers


Water scarcity, aging infrastructure, and workforce turnover are all key challenges to water-sector service and reliability that also conflict with a competing variable — affordability. A recently released report from Black & Veatch shows how far water service providers have come and how far they still have to go to make affordable water and wastewater services equitably accessible across the full spectrum of consumers.
That document, 2021 50 Largest Cities Water and Wastewater Report,1 from Black & Veatch Management Consulting, quantifies and addresses the rise in water and sewer rates as an outgrowth of multiple factors. These include aging infrastructure, operational costs, capital funding issues, regulatory requirements, and the impacts of the COVID-19 pandemic. It shows that in many of the cities, actual water rates are still well below the U.S. EPA’s Affordability Index, despite ongoing needs for new infrastructure investment. Yet when viewed through the lens of affordability — as a fraction of income or as minimum-wage hours required to pay the average water bill — regional disparities can be tremendous, especially for economically challenged areas.
About The Report
The 2021 report is the latest in a series of water/sewer-rate reports generated by Black & Veatch since 2001. The analysis methodology for the report utilized input from representatives among the top 50 U.S. cities providing water and sewer services (cities were ranked by population size). Using the applicable water/sewer rates for those cities as of December 1, 2020, the analysts calculated typical bills for various commercial, industrial, and residential account profiles.
How We Got To Where We Are
The Black & Veatch report addresses today’s state of residential and commercial/industrial water and sewer rates from a historical perspective as well as from a geographical perspective of affordability. Its findings include:
- Quality Of Service. The report notes that, in general, the American public has access to quality water and sewer services. But it also notes the disparity in financial impacts for different locations and income levels, some of the roadblocks of customer-assistance programs, and some potential approaches for achieving a more equitable sharing of the burden.
Compound Average Rate of Change in Surveyed Typical Bills (2001-2020)
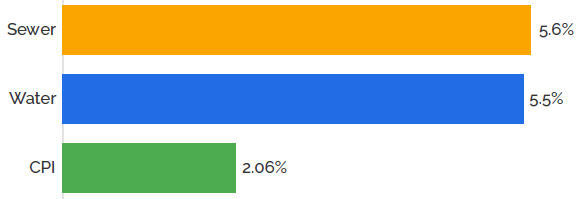
Inset A. Both water and sewer cost increases have outstripped the rise in the Consumer Price Index (CPI) over the 20-year period addressed in the report, indicating incrementally increasing pressures on the water/sewer budgets of lower-income households.
- Rate Growth. The analysis found that the compound average rate of change for surveyed sewer bills (5.6 percent) and water bills (5.5 percent) outstripped the compound rate of increase in the Consumer Price Index (2.06 percent) over the surveyed period from 2001 through 2020 (Inset A). This ultimately makes water utility charges an increasingly larger portion of customer cost-of-living expenses — a particular concern for historically lower-income households and those impacted by the COVID-19 pandemic.
- The Value Of Water. Despite increasing rates, the revenues generated by water and wastewater utilities do not generally reflect the true value of water relative to the costs of treating it and transporting it (Inset B). This can leave utilities at a disadvantage when it comes to maintaining infrastructure and keeping up with regulatory requirements necessary to sustain acceptable levels of service and resiliency.
- Affordability. Despite the generally increasing billing rates for water and sewer services, not all cities reflect the same impacts of water and sewer bills relative to earning power (Inset C).
- The eight cities with the highest volume of minimum-wage hours needed to cover the cost of the average water/sewer bills each month ranged between 8 and 12 hours.
- The seven cities with the lowest volume of minimum-wage hours needed to cover the cost of the average water/ sewer bills each month ranged between 2 and 4 hours.
- The remaining 35 cities ranged between 4 and 8 hours of minimum-wage earnings needed to cover the cost of the average water/sewer bill.
In addition to identifying those economic discrepancies, the report also goes into detail on some alternate measures of affordability for lower-income customers.
Potential Paths Forward
From the report, it is obvious that even many large water and sewer service providers have a tough row to hoe in order to make water bills equitable to all customers while still meeting their aging infrastructure challenges. Fortunately, there is hope on the horizon in the form of the Low-Income Water Customer Assistance Programs Act of 2021 (HR 3293)2, which was incorporated into the INVEST In America Act (HR 3684) passed by the House of Representatives July 1, 2021, and forwarded to the U.S. Senate for consideration. The Low-Income Household Water Assistance Program (LIHWAP) would function as a permanent, federally funded, low-income water-assistance program, similar to how the existing Low-Income Home Energy Assistance Program (LIHEAP) works.
There is also new infrastructure funding relief available specifically to rural communities with populations of 10,000 or less. That comes in the form of a $307 million program3 announced by the U.S. Department of Agriculture (USDA) on July 7, 2021, as part of that department’s Water & Waste Disposal Loan & Grant Program.4 It makes long-term low-interest loans and grants available to qualified state and local governmental entities, private nonprofits, and federally recognized tribes for water, wastewater, and stormwater infrastructure investments.
Typical Residential Water Bill for 7,500 Gallons Versus USEPA Affordability Target
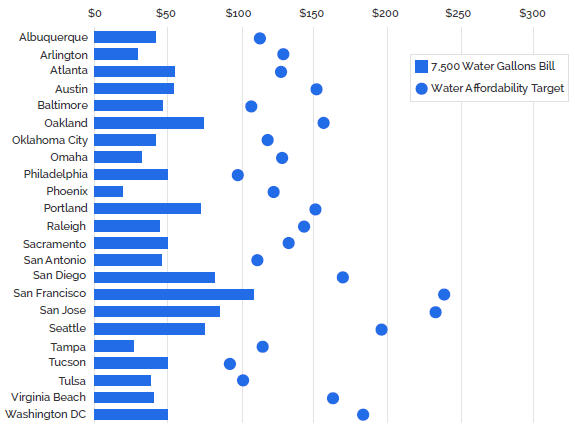
Inset B. For most of the water utilities serving the top 50 U.S. cities, actual billing rates are below the affordability levels established by USEPA guidelines, as represented in this abridged version of the report’s full chart. Residential sewer bills are typically a bit closer to EPA affordability targets, but only exceed those guidelines in eight of the 50 cities, according to the report.
Hours of Minimum Wage
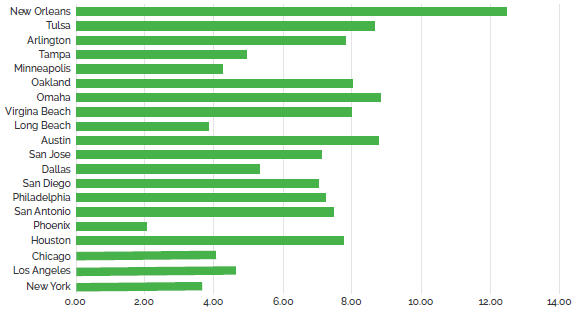
Inset C. As shown in this abridged version of the report’s full chart, what a typical household pays for water and sewer services can vary widely — from more than 12 hours at the prevailing minimum wage in New Orleans to as little as 2 hours at the prevailing minimum wage in Phoenix. Fortunately, new legislation is being proposed to relieve some of the resulting pressure on lower-income households.
References:
- https://www.bv.com/resources/2021-50-largest-cities-water-and-wastewaterreport
- https://uswateralliance.org/news/us-water-alliance-applauds-introduction-newfederal-bill-help-low-income-households-afford
- https://apnews.com/article/joe-biden-environment-and-nature-governmentand-politics-health-business-b1a0de5d37d590869e28515ec34cdd07
- https://www.rd.usda.gov/programs-services/water-waste-disposal-loan-grantprogram
About the Author
 Pete Antoniewicz is an industrial content writer at Water Online, where he draws on his journalism degree and experience writing for a variety of industrial and high-tech companies. He can be reached at pantoniewicz@wateronline.com.