
Smell Test: A Comparison And Ranking Of Hydrogen Sulfide Emission Factors

By Amitdyuti Sengupta with Linda Daly and Bhaskar Kura
How bad does your wastewater treatment plant (WWTP) really smell? Researchers provide a new perspective on headworks odor control and measurement.
Formation and release of hydrogen sulfide (H2S) gas from municipal wastewater is a well-recognized problem that has significant impacts on wastewater infrastructure. Impacts of generation and emission of H2S from wastewater include corrosion and reduction in the service life of wastewater infrastructure, odor nuisance in the community, and health impacts of wastewater operations and maintenance personnel (Neilsen, et al. WEFTEC 2006). Section 522 of Water Quality Act, 1987 mandates the U.S. EPA to study and document corrosion level in wastewater systems in the U.S. The EPA’s study “Hydrogen Sulfide Corrosion: Its Consequences, Detection and Control,” conducted on 89 municipalities in September 1991, revealed that 80 percent of the municipalities reported accelerated corrosion and collapse of the wastewater infrastructure.
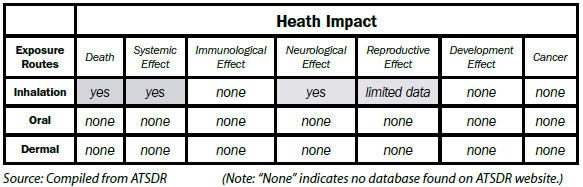
Health Impacts: H2S exposure is possible through various routes such as inhalation, oral, and dermal. In a wastewater treatment plant setup, operators face a high risk of H2S exposure. Table 1 lists the potential health impacts in humans from the Agency for Toxic Substances and Disease Registry (ATSDR).
Table 1: Exposure Routes And Associated Health Impacts
Economic and Social Impact: Water Infrastructure Network (WIN) reported in the year 2000 that 50 percent of the $23.5 billion spent nationally for replacement, repair, and addition to wastewater infrastructure all over the U.S. was due to hydrogen sulfide-related corrosion. Consistent H2S odor in a neighborhood has the potential to impact the quality of life and negatively influence property prices in the area. Strict air quality regulations and greater public concerns have led to an increased social focus on odor-related issues (Kim et al. 2007). Figure 1 shows corrosion on a sluice gate valve and bar screen at the headworks.
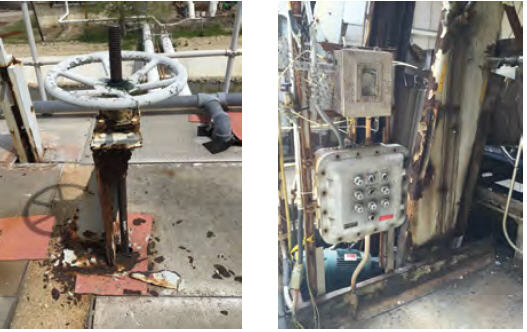
Figure 1. Corroded valve and bar screen at monitoring site headworks
Need For Research
Conventional odor control studies performed by municipalities to design their individual odor/corrosion control strategies largely depend on establishing a dilution to detection threshold (D/T) ratio and ascertaining the recognition threshold (R/T) for air samples collected from the study area. Often these samples for R/T and D/T are collected using a few grab samples (instantaneous samples using tedlar bags) over a period of a few days. Continuous sampling is rarely done since it is cost-prohibitive and time-consuming. These conventional odor studies based on R/T and D/T have a number of limitations and lead to inaccurate conclusions. Therefore, there is a demand for rapidly and economically identifying and forecasting H2S emissions from various wastewater infrastructures.
Methodology
To reduce detrimental health, social, and economic impacts, air quality management tools such as emission factor (EF) for estimating H2S emissions from a wide variety of sources including wastewater facilities are very useful. Per the EPA, “an air quality emission factor is the relationship between the amount of pollution released and the amount of raw material processed, or amount (number) of product (units) produced, or amount of work done.” Examples of emission factors include: mass of CO2 emitted per distance driven by a vehicle (kg-CO2/km-driven), mass of SO2 produced per unit amount of electricity produced (kg-SO2 /KWHelectricity produced), and others. Determining EF is considered an important step in assessing air pollution and subsequent control.
Since 1972, the EPA has published AP-42 Compilation of Air Emission Factors (AP-42), which is a collection of EFs and process information for more than 200 air pollution source categories from a wide range of industry sectors (Technology Transfer Network, Clearinghouse for Inventories and Emission Factors; EPA).
In this study, the pollutant of concern is H2S from various WWTP headworks, and the parameters to describe the “unit of measure” for normalization are: 1.) flow of wastewater processed by the WWTP, 2.) population served by a particular WWTP, and 3.) service area associated with the WWTP. EF is an average value obtained from a long-term observations study performed during normal operations of the polluting unit. AP-42 indicates that EF formulae, which include variable parameters such as temperature, wind velocity, and pollutant unit dimensions produce a more realistic estimate. In line with the EF guidelines established by AP-42, this study based its EF calculation methodology on variables such as:
- H2S emissions using continuous H2S concentrations within the headworks’ influent chamber (sampling every 5 minutes for six months);
- wastewater flow received at the WWTP;
- service area; and
- population served.
This research attempted to determine H2S EFs for headworks at four WWTPs based on field measurements of H2S emissions and other parameters. These EFs are expressed as a function of (a) wastewater flow (EF-Flow), (b) population (EF-Population), and (c) area served (EF-Area). Four Jefferson Parish WWTP headworks — East Bank (shown in Figure 2), Marrero, Harvey, and Bridge City — were chosen as the sites for this evaluation study/pilot project as all flows pass through these units, and it also has one of the highest potentials to generate H2S. Based on the findings of this evaluation study, researchers could modify their methodology for any future research in this area.
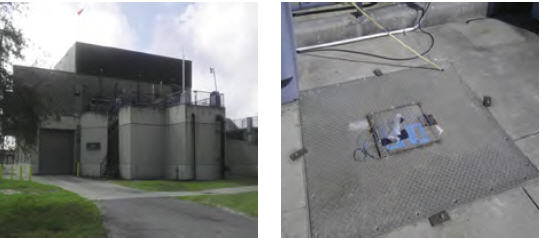
Figure 2. East Bank WWTP headworks and air sampling location on top of the headworks unit
Results
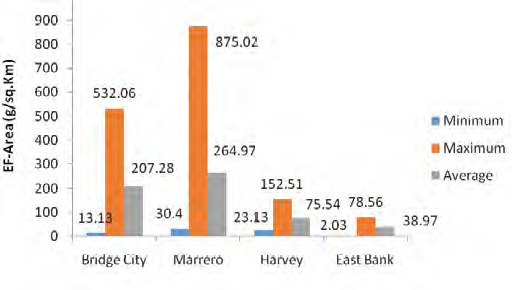
Comparison Of EF Ranges Among Various WWTP Headworks: Figures 3 to 5 at right show the comparison of EF-Flow, EF-Population, and EF-Area among all four WWTPs in terms of maximum, minimum, and average EF values. It was observed that the weekly average EF-Flows calculated for Marrero and Bridge City WWTPs are 5 percent apart, whereas the average EF-Flows for Harvey and East Bank WWTP are 3 percent apart. Similarly, the weekly average EF-Populations for Marrero and Bridge City WWTP were calculated to be 32 percent apart, while the weekly average EF-Populations for Harvey and East Bank WWTP were calculated to be 72 percent apart. Finally, the weekly average EF-Areas for Marrero and Bridge City WWTP were calculated to be 22 percent apart, while Harvey and East Bank WWTP’s weekly average EF-Areas were 48 percent apart.
Figure 3: Comparison Of EF-Flow Among WWTPs
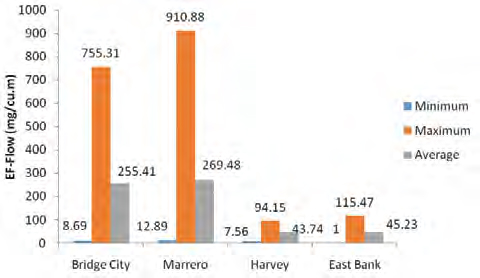
Figure 4: Comparison Of EF-Population Among WWTPs
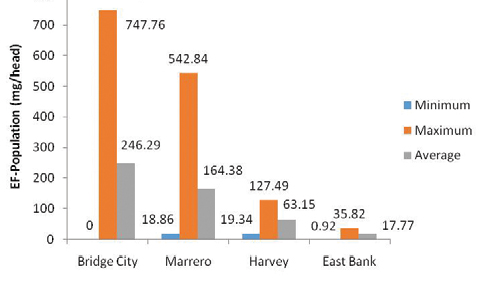
Figure 5: Comparison Of EF-Area Among WWTPs
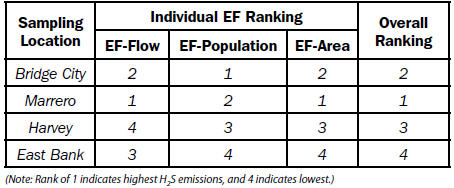
Based on the average values calculated for the entire sampling period, Table 2 provides the preliminary ranking of WWTP (in terms of emission potential) based on individual EFs. The overall ranking was established by taking into account the individual EF rankings generated based on various EF calculations.
Table 2: Comparison Of Ranking Of Sampling Locations
In an attempt to understand the differences in the EFs from various treatment plants, attention was directed to:
- analyzing wastewater parameters, and
- the type of collection system.
Research was also performed to generate an empirical formula to forecast H2S emissions. Discussions of these items are beyond the scope of this article, however.
Conclusion
Based on the literature review, it was observed that the conventional air emission studies are resource-intensive and time-consuming and typically require an outside agency to perform testing, data collection, and interpretation. Present studies also do not establish any emissions model that can be used by in-house municipal staff for predicting H2S emissions in their respective sewer system. Discussions with Jefferson Parish municipalities revealed that an in-house air emission testing capability would serve as a great tool to identify potential locations for health risk, odor, and corrosion hot spots, particularly due to H2S emissions. This study serves as a demonstration tool for using EFs to ascertain H2S ranges. Based on the findings of this study, future experiments can be designed to expand this air emission tool for other closed treatment units and collection systems. Also, similar studies can be designed to ascertain concentrations of multiple gases associated with sewers.
The results of this study provide a range of EFs for four WWTP headworks based on wastewater flow handled, population served, and the service area. These EFs can be used by the Jefferson Parish personnel in understanding the day-to-day H2S emission potential of headworks at these various WWTPs by knowing one of the variables: (a) flow rate, (b) population, or (c) service area. Emission potential at other headworks of WWTPs of similar size and scope can be estimated using the EFs presented in this paper.
About The Authors
 Amitdyuti Sengupta, Ph.D., serves as program manager for the Jefferson Parish Sewer Capital Improvements Program, managing close to $85 million of wastewater-related projects. His work includes wastewater, stormwater, and air quality projects. He can be reached at asengupta@jeffparish.net.
Linda Daly, PE has been the director of the Jefferson Parish Department of Sewerage since March 2011. In this position, she oversees a department of 200 employees with a $30 million annual operating budget.
 Bhaskar Kura, Ph.D., PE, is Associate Dean of Engineering, Program Development; Professor of Civil & Environmental Engineering; and Director of Maritime Environmental Resources & Information Center (MERIC) at the University of New Orleans.