
Do-It-Yourself Crypto Detection

By Kevin Westerling,
@KevinOnWater
Learn how to construct a simple and inexpensive tool for detecting Cryptosporidium in your watershed — and why it’s important.
As advanced as monitoring has become, Cryptosporidium has seemingly slipped through the cracks. The accepted EPA method of detection, mandated by the Long Term 2 Enhanced Surface Water Treatment Rule (LT2), is to catch oocysts (the infectious dormant form of "crypto") in capsule filters. It is neither simple nor cheap — and not terribly accurate, considering its cost. So what if you could build a better crypto trap?
A new, do-it-yourself crypto detection system has been developed by researchers at Lehigh University through a project funded by the Philadelphia Water Department (PWD) and tested in Philadelphia area waters, with promising results. So far, the “home-made” alternative to the current standard (EPA Method 1623) has provided very comparable detection results, but at a fraction of the cost. This allows for more units to be deployed throughout the watershed, possibly providing utilities an additional tool for detecting Cryptosporidium.
Researcher Kristen Jellison, associate professor at Lehigh's Department of Civil & Environmental Engineering, calls the device a “biofilm sampler.” It is simply a box containing microscope sample slides — at a cost of roughly $3 each — that is placed in a body of water at the location of interest. Jellison, who holds a Ph.D. from MIT and a B.S. from Cornell University, had done past work, along with others, in proving that biofilms are good receptors of oocysts, but the PWD pilot study marks the first time biofilms (which grow on the slides) have been used to monitor crypto in a watershed.
“It’s a very easy way to see if crypto are present in your watershed and where, without spending hundreds of dollars on the filters,” said Jellison.
Standard Filter Performance Problems
As the next round of LT2 approaches — monitoring for large facilities (serving at least 100,000 people) begins in April 2015 — utilities of all sizes may recollect the pain points from using EPA Method 1623 in the initial round. The capsule filters are prone to clogging in turbid conditions, which often necessitates a second filter to collect the required 10 liters of water for a valid sample. At $100 or more per filter, per sample, anything beyond the bare minimum gets expensive.
“It racks up really quickly,” stated Jellison. “A utility with a smaller budget is limited as to how often and how many different locations they can sample.”
Furthermore, the results of the EPA method are quite variable. In one study (McCuin and Clancy, 2003), oocysts were seeded in both clean tap water and raw source water, then repeatedly tested using EPA Method 1623. The range of recoveries — or how many oocysts were detected compared to the known quantity put in — was 23.5 to 71.2 percent for the tap water, and 19.5 to 54.5 percent for the raw water. The high incidence of undetected oocysts means that crypto presence could be greater than tests indicate.
“With recoveries so variable, it becomes questionable if you don't detect anything,” Jellison noted. “Is it because it really wasn't there, or because you only had a 30 percent recovery? You may or may not catch it.”
The method can also be misleading in that it only provides a “snapshot” of place and time. The oocysts you gather in 10 liters of water at a single collection point, over the course of time it takes to collect a sample (perhaps 30 minutes), is almost coincidental. As Jellison pointed out, “You could have had an oocyst in there the day before or the hour after you leave, or even while you were there, but not in your 10-liter sample.”
The biofilm sampler improves on at least two of these pain points, creating the opportunity for better understanding of crypto occurrence in a water body.
Biofilm Sampler vs. Filter
The first advantage is cost. Because the biofilm sampler’s materials are so much cheaper than the filters required under LT2 guidelines, many samplers can be constructed and used for monitoring throughout the watershed.
A second advantage is that the biofilm samplers can stay in the watershed for any length of time, which is a matter of convenience, opportunity (to catch more oocysts), and local factors. There is no optimal duration period established for the biofilm samplers; it may be variable according to location, weather, and source water. At PWD, Jellison and colleagues replaced the biofilm sampler every two weeks simply to coincide with the EPA-approved filter sampling.
As both the biofilm samplers and the filters were drawn from the watershed at the same time, results of the samples were compared. Samples were routinely taken in the source water prior to entering the intake of the PWD water treatment plant (WTP) and from a location further upstream. Over the course of a full year (July 2013 to July 2014), the frequency of detection was remarkably similar (see Table 1).
|
|
Water Source |
|
Biofilm Sampler |
46% positive (18/39) |
|
Filter (EPA) Method |
43% positive (17/40) |
Table 1. The biofilm sampler and EPA-approved filter method returned a similar frequency of oocyst detection at two collection points.
This comparison study suggests that, with regard to oocyst detection, the biofilm method is on par with the EPA-approved filter method. The pilot project did not include the seeding of oocysts, and therefore does not speak to the variability of recovery — an established flaw with the filter method, but a complete unknown with the biofilm method. Volume concentrations of the water passing through the biofilm sampler are another unknown.
It’s because of the many as-yet unknowns that Jellison calls biofilm sampling a “long way” from becoming EPA-approved. Outside of LT2 testing, however, biofilm samplers can have significant impact.
“It's cheaper, so you can sample in more locations at a higher frequency, over longer spans of time, and really understand where the sources of crypto are in your watershed,” summarized Jellison.
In other words, instead of the snapshot image, water quality managers can now get the big picture. By obtaining relative data on oocyst concentrations — where and when they appear — mitigating actions such as source water protection plans or the installation of best management practices (BMPs) can be developed in areas where they will be most effective.
How To Build A Biofilm Sampler
To start monitoring oocysts and the threat of Cryptosporidium in your own watershed, you need only a sturdy container and standard microscope slides. The container will need two open sides to permit water flow, as well as slots to hold the slides in place; mesh or a similar material should also be used to cover the open sides and prevent large debris from breaking the slides (see Figure 1).
The PWD team utilized two weighted PVC pipes to keep the units submerged in the watershed (Figure 2), but they collected samples from the source water just prior to the WTP intake by hanging the biofilm sampler from a rope off a dock.
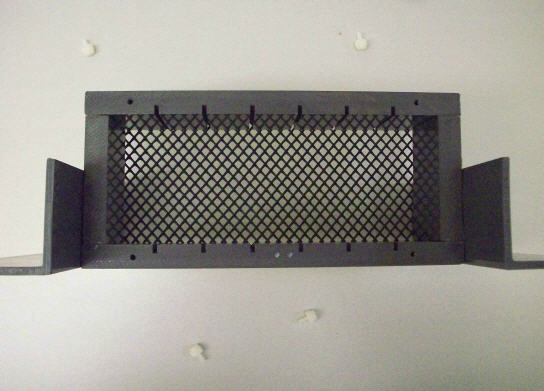
Figure 1. The simple construction of the PWD biofilm sampler includes slots for (6) slides and protective mesh siding.
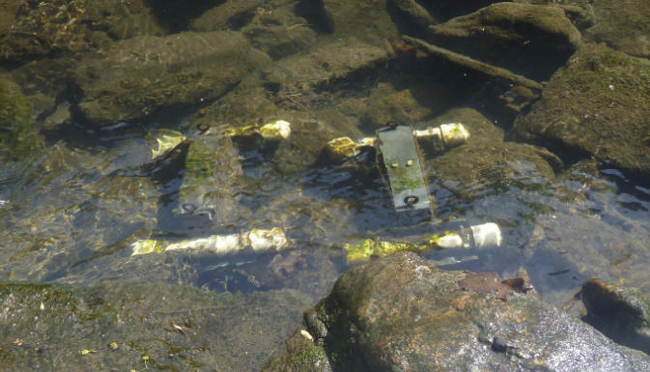
Figure 2. Weighted PVC pipes help keep the biofilm samplers in place.
Once the biofilm sampler is retrieved, the slides are simply scraped to remove the biofilms; by contrast, the second step of the standard method requires the filtered content to be eluted. The remaining steps are exactly the same as with the filter method under EPA Method 1623: immunomagenetic separation (IMS) followed by immunofluorescent microscopy (IFA) — steps familiar to any utility that has done previous crypto/LT2 monitoring.
The Future Of Crypto Detection
The next step on the road toward validation for the biofilm filter is to have more utilities try it out in the field to help gather information, work out the kinks, and develop best practices. A sticking point, so to speak, is how biofilms behave in different areas.
“Is any biofilm going to be equally sticky for Cryptosporidium, or are there specific things about the biofilm that make crypto more or less likely to attach? That’s what we need to figure out,” Jellison explained.
She has already made some inroads, finding that “rough” biofilms catch more oocysts than smooth ones, as they tend to get caught in the crevices. Ultimately, she hopes to develop a synthetic surface that can be used anywhere, with a known attachment efficiency. Until then, she welcomes the participation of others, and is optimistic that there will be benefit for other “do-it-yourselfers.”
“I think it's absolutely worth trying,” she said. “And based on what we see here [in Philadelphia], I think it will give good information. If other people want to use it in their watersheds and share their findings, I see that as a really useful collaboration on both ends.”
For more information (or collaboration), contact Kristen Jellison at kjellison@lehigh.edu.
Reference:
McCuin, R.M. and J.L. Clancy. 2003. Modifications to USEPA methods 1622 and 1623 for detection of Cryptosporidium oocysts and Giardia cysts in water. Applied and Environmental Microbiology 69:267-274.